Figure 3.
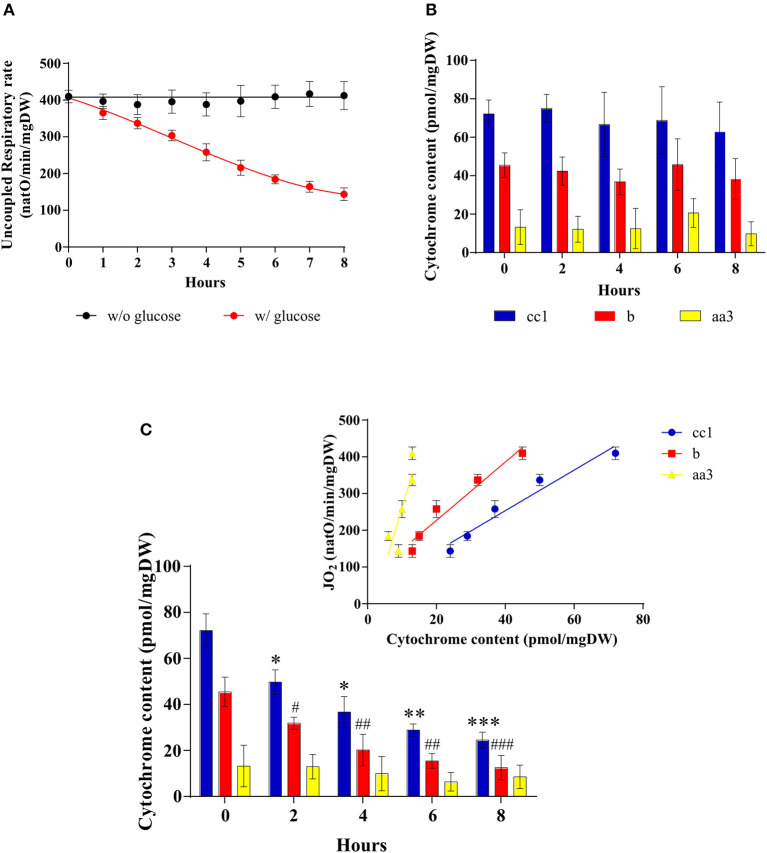
Mitochondrial amount after induction of the Warburg effect in S. cerevisiae. The growth medium of S. cerevisiae was supplemented with 60 mM of glucose at T0 () or not (•). (A) The uncoupled respiratory rate was followed for 8 h. Results shown represent means of at least five separate experiments ± SD. (B) Cytochrome content was quantified every 2 h in cells in absence of glucose in the medium. Results shown represent means of at least three separate experiments ± SD. (C) Cytochrome content was quantified every 2 h in cells after glucose addition in the medium. Inset: A linear regression between respiratory rate and cytochrome content is presented for each cytochrome. Results shown represent means of at least four separate experiments ± SD. For each condition values are compared to the corresponding T0 and the p-value is represented as * for cc1; # for b.

