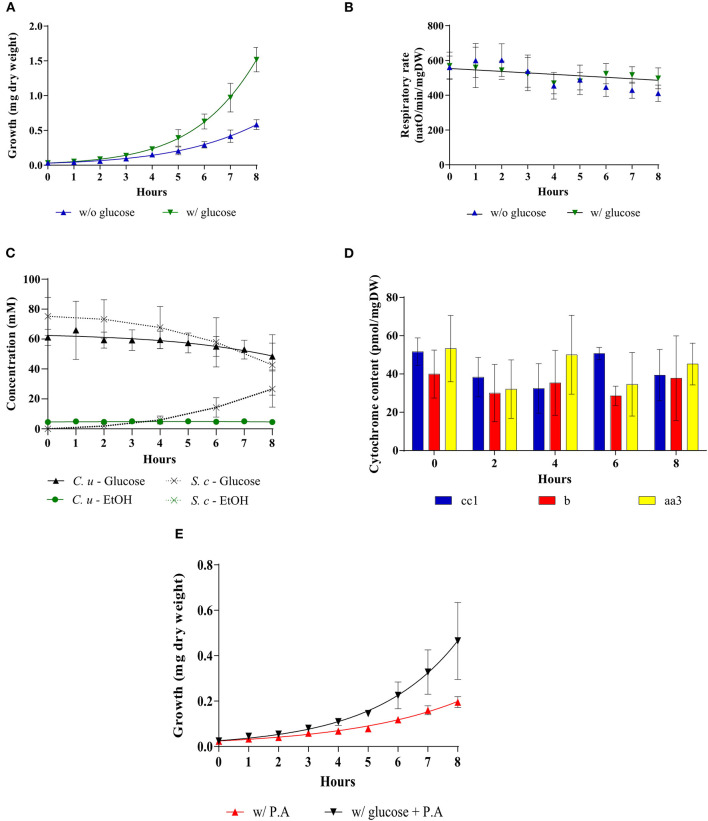
Figure 6.
Addition of glucose to a Crabtree-negative strain, Candida utilis. The growth medium was supplemented with 60 mM of glucose at T0 () or not (). (A) Growth was followed for 8 hours. Results shown represent means of at least 15 separate experiments ± SD. (B) The respiratory rate was followed for 8 h. Results shown represent means of at least 15 separate experiments ± SD. (C) Glucose consumption (• C. utilis) or (x S. cerevisiae) and ethanol production ( C. utilis) or (x S. cerevisiae) were quantified. Results shown are means of at least four separate experiments ± SD. (D) Cytochrome content was quantified every 2 h after glucose addition to the medium. Results shown represent means of at least five separate experiments ± SD. (E) For each condition, growth was followed for 8 h in the presence or absence of Piericidin A (200 μM). Results shown represent means of at least three separate experiments ± SD.

