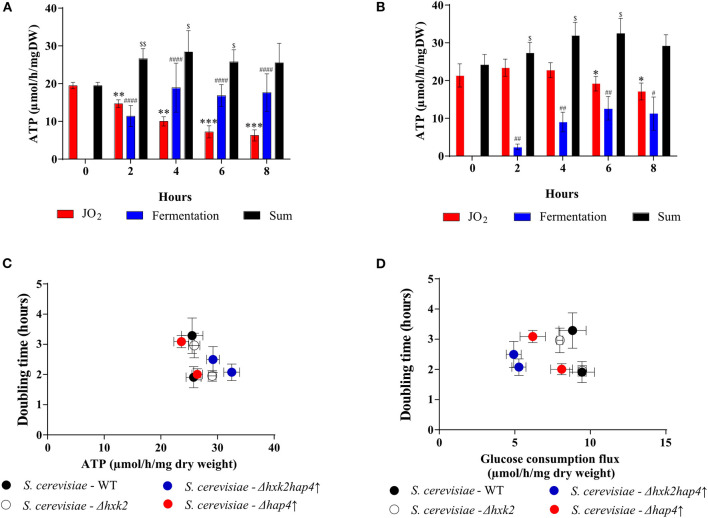
Figure 8.
Effect of glucose on ATP synthesis flux in the different strains. ATP synthesis flux was calculated from the respiratory rate and the ethanol production flux according to the oxidation balance-sheet: ½ O2 = 1,5 ATP for respiratory rate; 1 EtOH = 2 ATP for fermentation to (A) S. cerevisiae- WT and (B) S. cerevisiae - Δhxk2hap4↑. (C) Growth as a function of ATP synthesis flux at T6 and T8. (D) Growth as a function of glucose consumption flux at T6 and T8. For each strain, in the presence of glucose, doubling times were calculated between 4 and 6 h and then between 6 and 8 h after glucose addition in the medium. (•) S. cerevisiae WT, () Δhap4↑, () Δhxk2, () Δhxk2hap4↑. For each condition values are compared to the corresponding T0 and the p-value is represented as * for JO2; # for Fermentation; $ for Sum.

