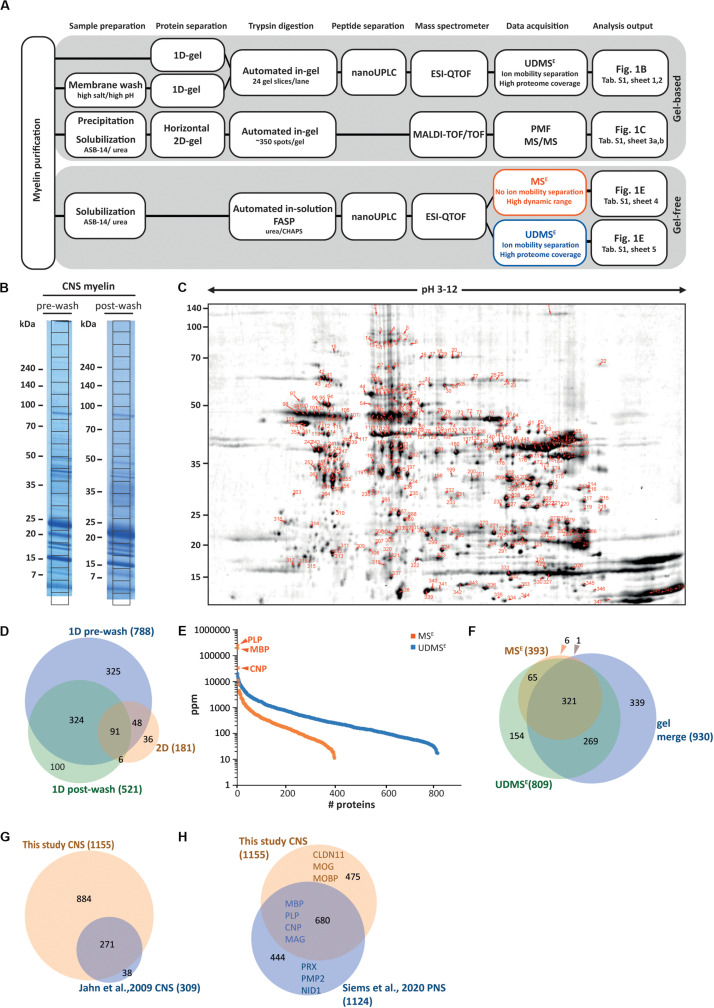
FIGURE 1.
Proteome analysis of CNS myelin. (A) Schematic illustration of the gel-based (top) and gel-free (bottom) proteomic workflow to approach CNS myelin purified from the brains of wild-type c57Bl/6N mice dissected at P75. Note that gel-free proteome analysis enables largely automated sample processing and omits labor-intense gel-electrophoresis, thus reducing hands-on time. (B) One-dimensional gel-separation of CNS myelin. Myelin was separated by SDS-PAGE without (pre-wash) or upon (post-wash) depleting soluble and peripheral membrane proteins by an additional step of high-pH and high-salt conditions. Proteins were visualized with colloidal Coomassie (CBB250). The denoted grid subdivides each lane into 24 equally sized slices, which were excised for automated tryptic digest, peptide separation by nanoUPLC and data acquisition using an ESI-QTOF mass spectrometer, thereby identifying 788 (pre-wash) and 521 (post-wash) proteins, respectively (see Supplementary Table S1). (C) Two-dimensional gel-separation of CNS myelin. Myelin was two-dimensionally separated using a 2D-IEF/SDS-PAGE with isoelectric focusing (IEF) in a 24 cm gel strip with nonlinear pH-gradient (pH 3–12) as the first and 10–15% acrylamide gradient SDS-PAGE (25.5 × 20 cm, gel thickness 0.65 mm) as the second dimension. Proteins were visualized by colloidal Coomassie staining; protein spots were excised, subjected to automated tryptic in-gel digestion and MALDI-TOF mass spectrometry, thereby identifying 181 non-redundant proteins from 352 spots (Supplementary Table S1). (D) Venn diagram comparing the number of proteins identified in CNS myelin by the three gel-based approaches. (E) Number and relative abundance of proteins identified in myelin purified from the brains of wild-type mice using two gel-free data acquisition modes (MSE, UDMSE). Note that MSE (orange) identifies comparatively fewer proteins in purified myelin but provides a dynamic range of more than four orders of magnitude. UDMSE (blue) identifies a larger number of proteins but provides a dynamic range of only about three orders of magnitude. Note that the dynamic range of MSE is required for the quantification of the exceptionally abundant myelin proteins proteolipid protein (PLP), myelin basic protein (MBP) and cyclic nucleotide phosphodiesterase (CNP). Samples were analyzed in three biological replicates with four technical replicates each (duplicate digestion and injection). For datasets see Supplementary Table S1. ppm, parts per million. (F) Venn diagram comparing the number of proteins identified in CNS myelin by MSE, UDMSE and gel-based approaches. (G) Venn diagram of the proteins identified in CNS myelin in this study compared with those identified in a previous approach (Jahn et al., 2009). (H) Venn diagram comparing the proteins identified in CNS myelin in this study with those previously identified in PNS myelin (Siems et al., 2020). Selected marker proteins are denoted.

