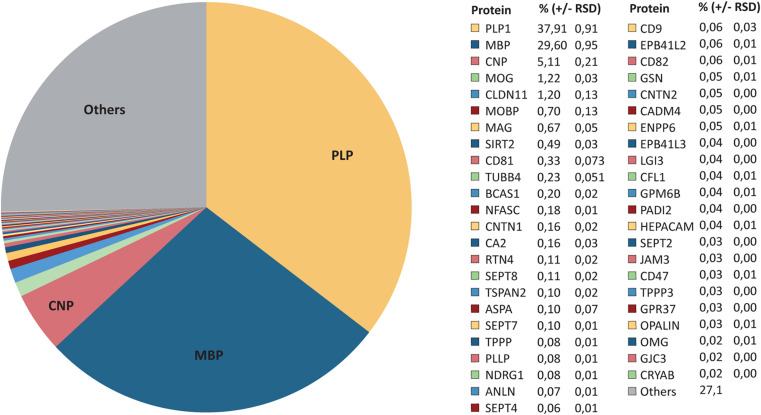
FIGURE 2.
Relative abundance of CNS myelin proteins. Pie chart of the MSE dataset shown in Figure 1E and Supplementary Table S1. The relative abundance of known myelin proteins is given as percent with relative standard deviation (% ±RSD). Note that known myelin proteins constitute approximately 73% of the total myelin protein; proteins so far not independently validated as myelin proteins constitute about 27%.

