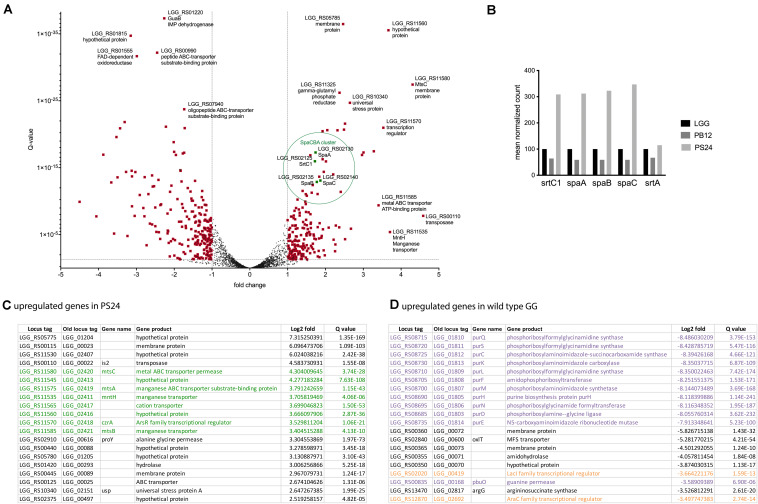
FIGURE 2.
Transcriptomic analysis of PS24 compared to wild-type L. rhamnosus GG at OD600 nm 2. (A) Volcano plot of differential expression compared for L. rhamnosus GG and PS24. Log2 fold change versus q-value is depicted. Data points marked in red have a log2 fold larger than 1 and a q-value smaller than 0.05. Positive fold change implies higher expression in the PS24 strain. (B) Mean normalized pili transcript count. Normalized expression of the spaCBA-srtC1gene cluster in the pilus-less PB12 derivative and PS24 derivative relative to wild-type L. rhamnosus GG. The housekeeping sortase A was included for comparison. (C) Top 20 upregulated genes in PS24 derivative. The top 20 genes with the highest log2fold value compared to wild-type L. rhamnosus GG at OD600 nm 2. (D) Top 20 downregulated genes in PS24 derivative. The top 20 genes with the highest log2fold value in wild-type L. rhamnosus GG at OD600 nm 2, compared to the PS24 derivative.

