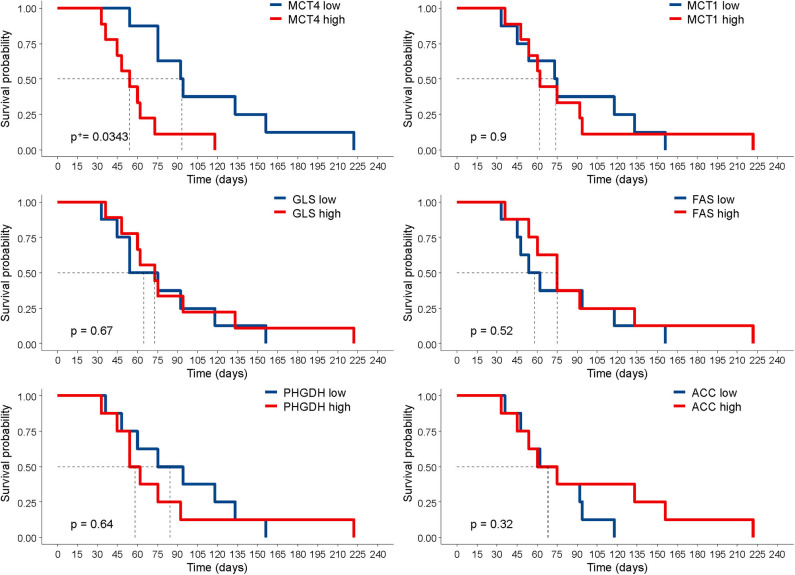
Figure 3.
Correlation of marker expression with survival. Kaplan–Meier curves according to the levels of marker expression, dichotomized according to their median value. Statistical significance was calculated with the log-rank test. +P-value was adjusted for multiple comparisons using the Benjamini–Hochberg method.

