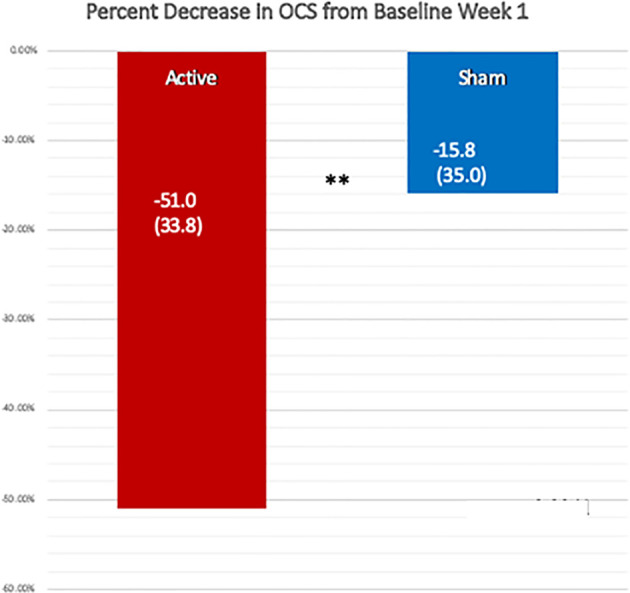
Figure 3.

Comparison of the percent reduction in the Opioid Craving Scale one week after the active and the sham treatments, using the OCS from week 1 before treatment as the baseline. The change after the active treatment, −51.0% (SD 33.7) was significantly greater than that following the sham treatment, −15.8% (SD 35.0), by a one-sided, Wilcoxon Test, **p = 0.004. Cohen’s ∂ was 0.73 for the active treatment over sham.
