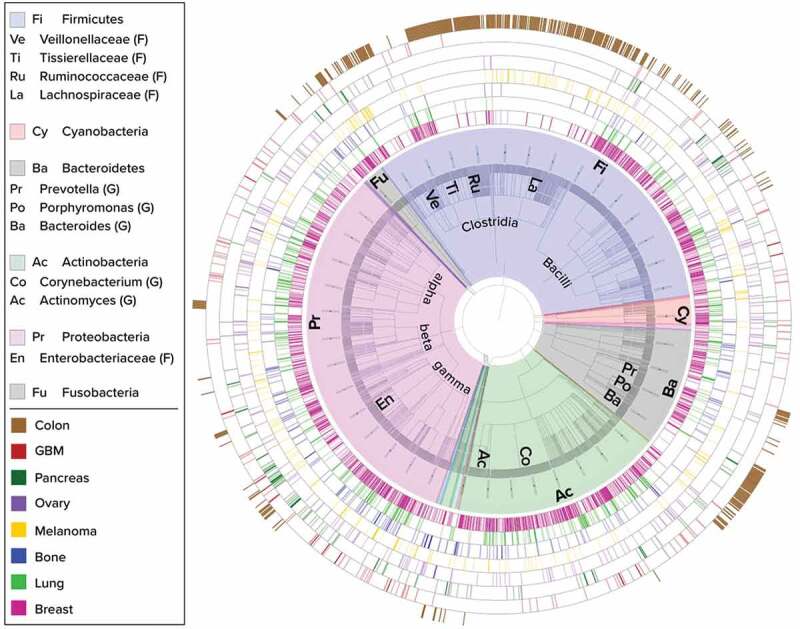
Figure 1.

Phylogenetic display of bacteria present in eight solid tumor types. Taxonomic classifications of the bacteria found in tumors are represented as a circular phylogenetic tree with equal branch lengths, overlaid with a color-coded pie-chart according to Phylum classification. Major phyla and sub-clades are annotated with short abbreviations which are expanded in the legend (F – family level, G – genus level). Bacteria at the species level are the outer leaves of the tree and appear as a dense gray outer circle within the pie-chart. Each surrounding ring depicts a different tumor type as indicated by the second legend. Each bar in the rings represents the status of the bacterial species corresponding to its location along the perimeter of the tree, within the specific tumor type: dark color shade indicates that the species passed all filtering stages of our stringent 16S rRNA sequencing analysis pipeline, light color shade indicates species that passed all filters except those related to specific medical center considerations. All tumor types display diverse bacterial profiles spanning several major phyla. Breast tumors (pink inner ring) display high diversity and richness of bacteria. Colon (brown outer ring) was sampled and added as an eighth tumor type of higher bacterial biomass and has a more distinct profile largely comprised of Bacteroidetes and Firmicutes.
