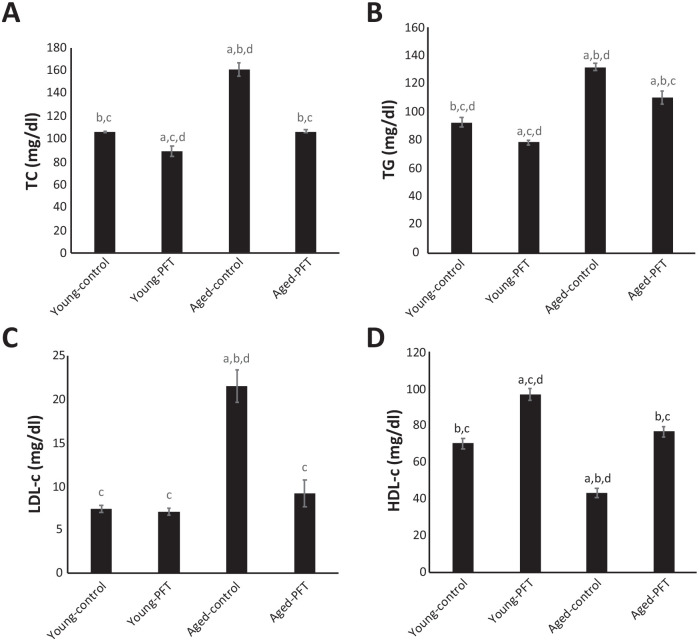
Figure 9.
Effect of PFT on lipid levels in the serum of young and aged mice. Each value represents the mean ± SEM for eight animals per group.
aSignificantly different from Young-control at P < 0.05.
bSignificantly different from Young-PFT at P < 0.05.
cSignificantly different from Aged-control at P < 0.05.
dSignificantly different from Aged-PFT at P < 0.05.

