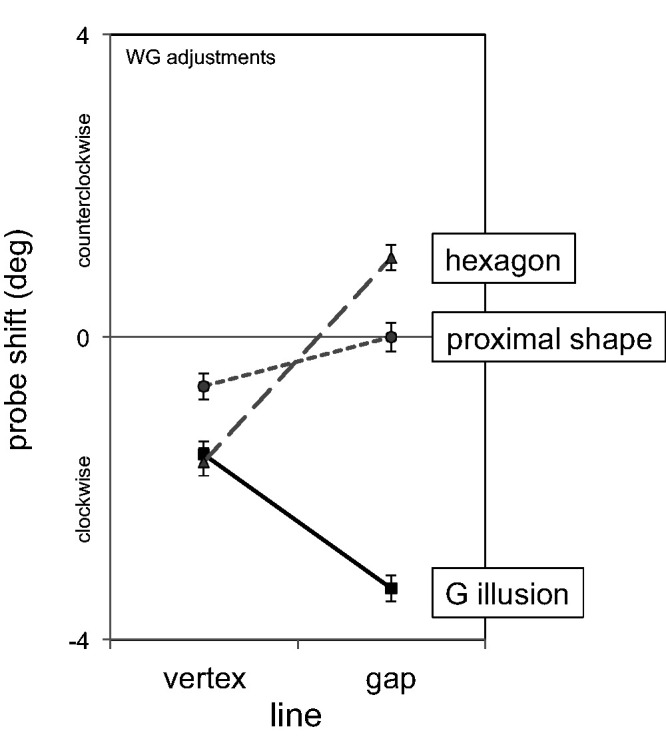
Figure A2.

Mean Collinearity Adjustments (±1 SEM) for the Three Displays in Two Observation Conditions (attending to the vertex vs. gap line). Each point is the average of 40 adjustments (after pooling data from upper left and lower right sides). All relevant differences are significant at the p <.001 level.
