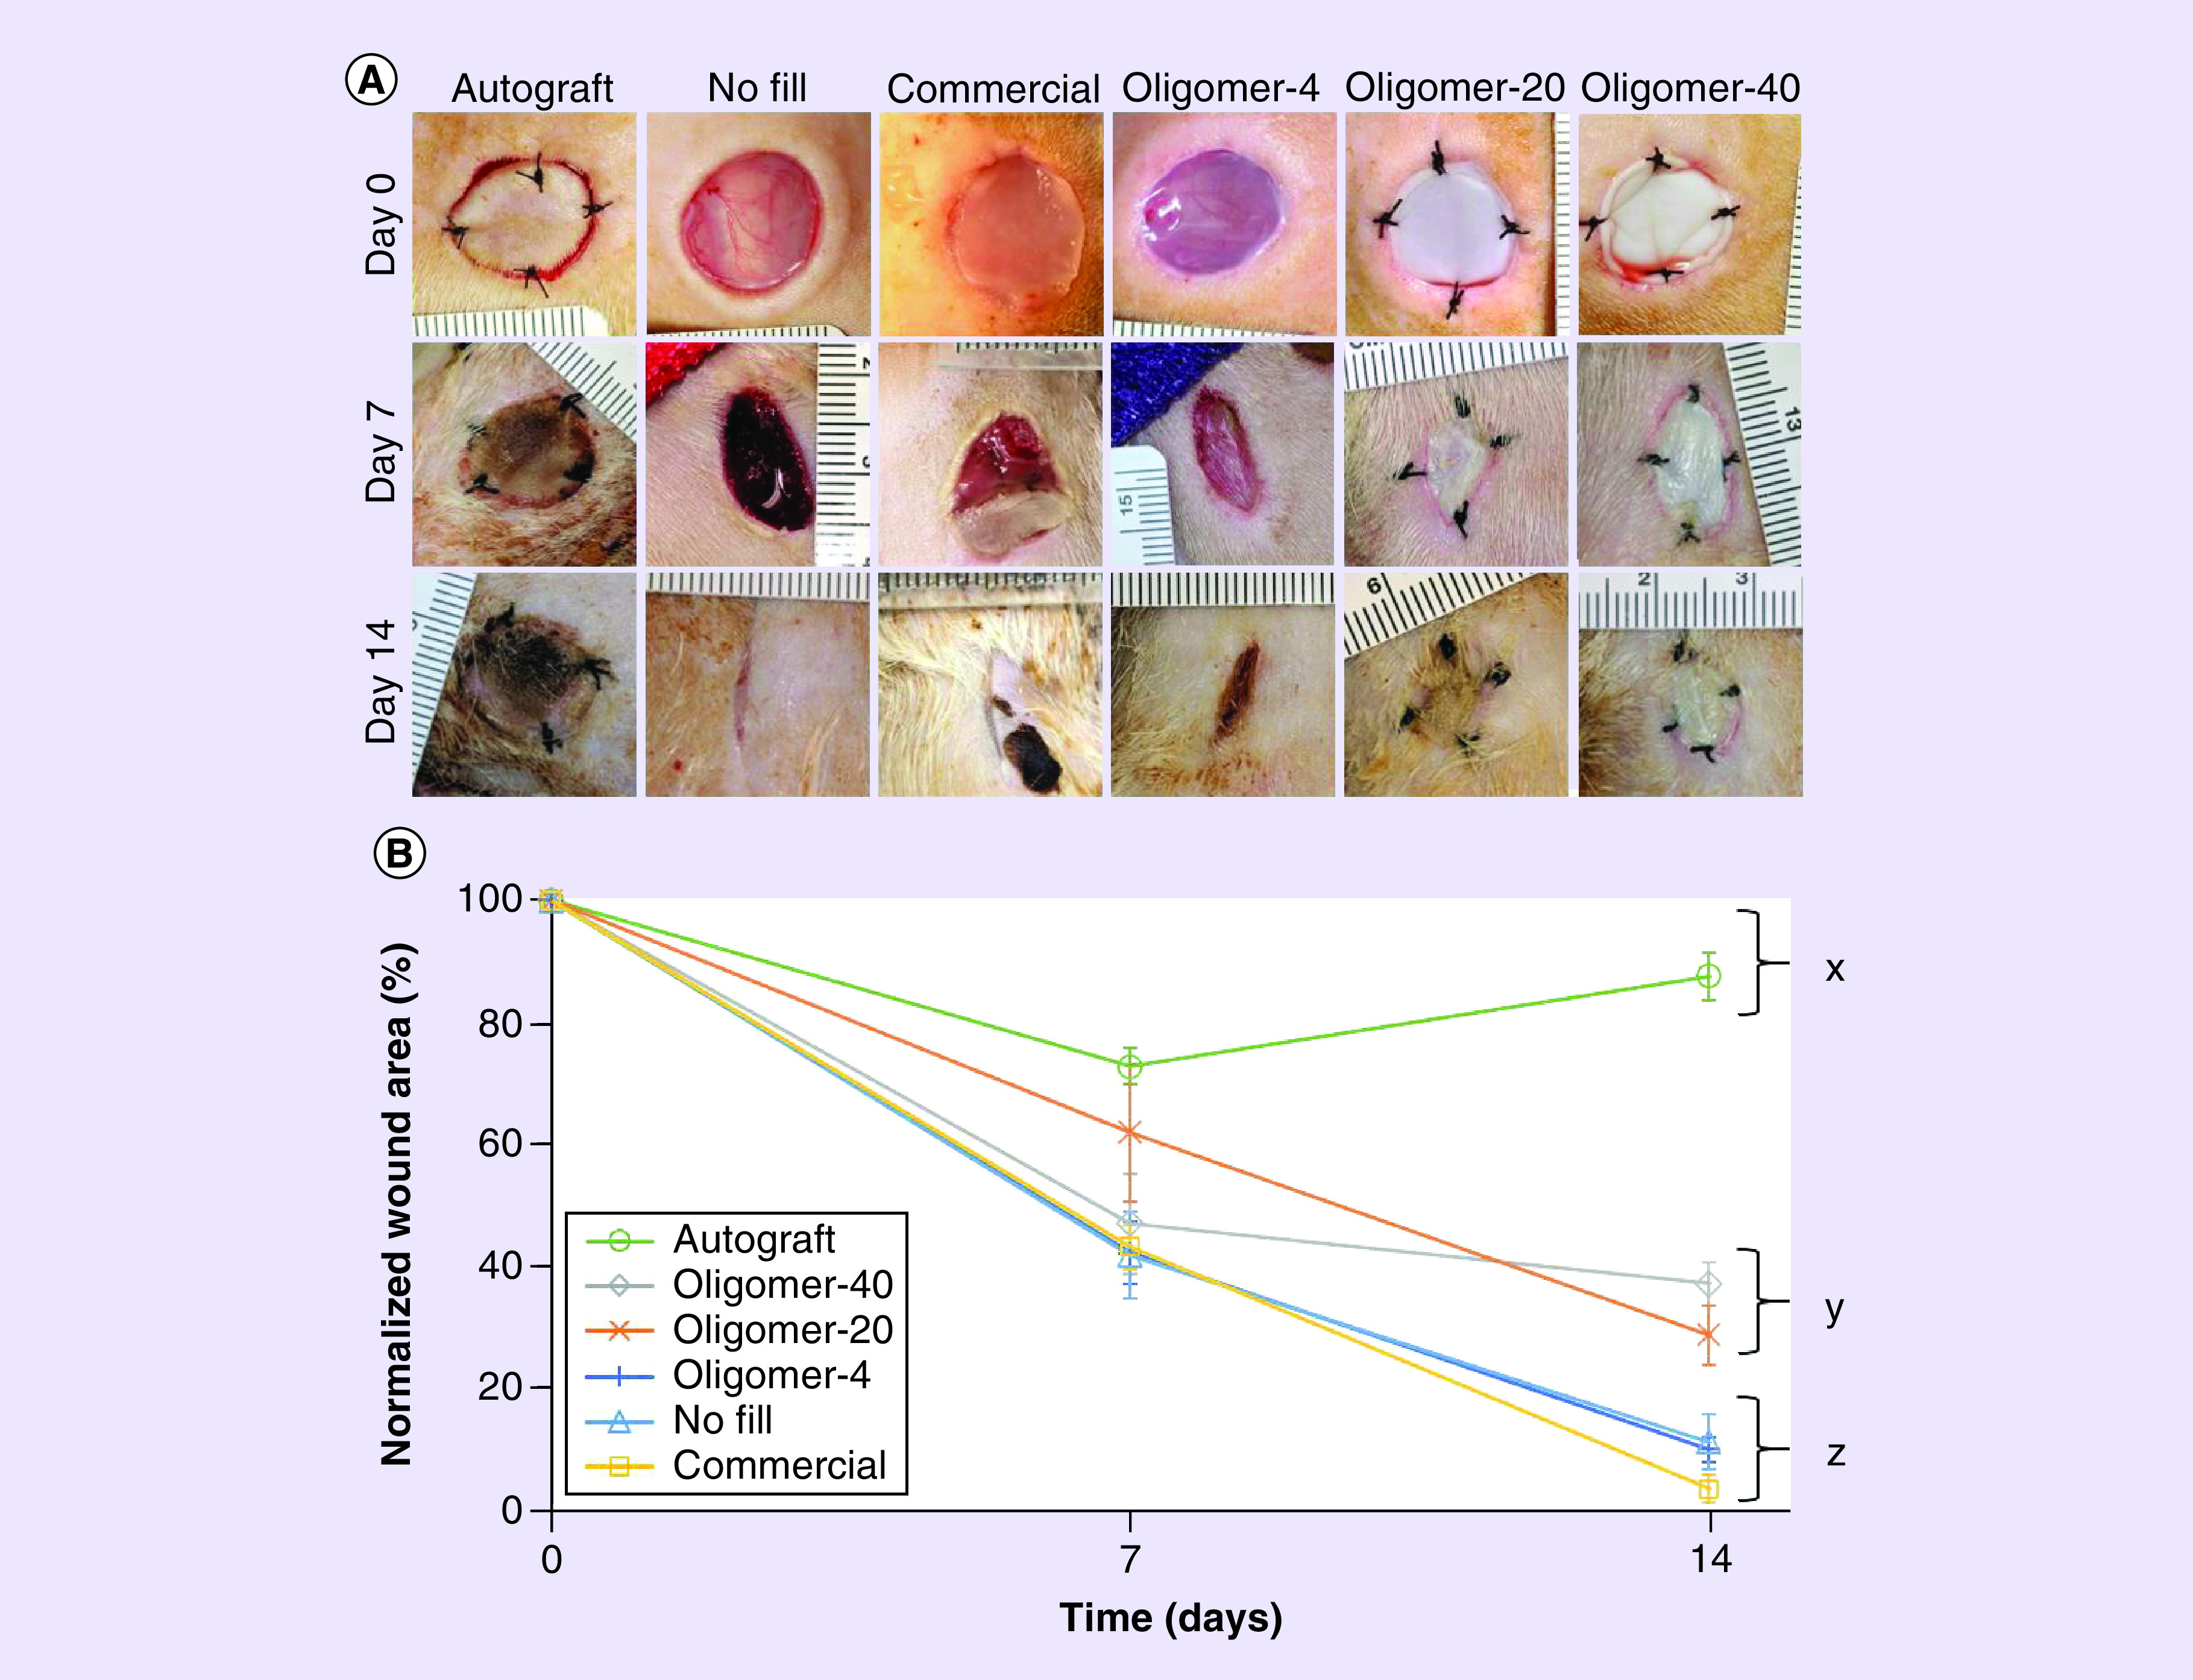
Figure 4. . Time-dependent changes in wound appearance and contraction for treatment and control groups.

(A) Representative gross images of full-thickness skin wounds at 0, 7 and 14 days following various treatments. (B) Graph showing time-dependent changes in normalized wound area for each group (mean ± standard deviation; n = 4–8 for control and experimental groups). Letters indicate statistically different groups; p < 0.05.
