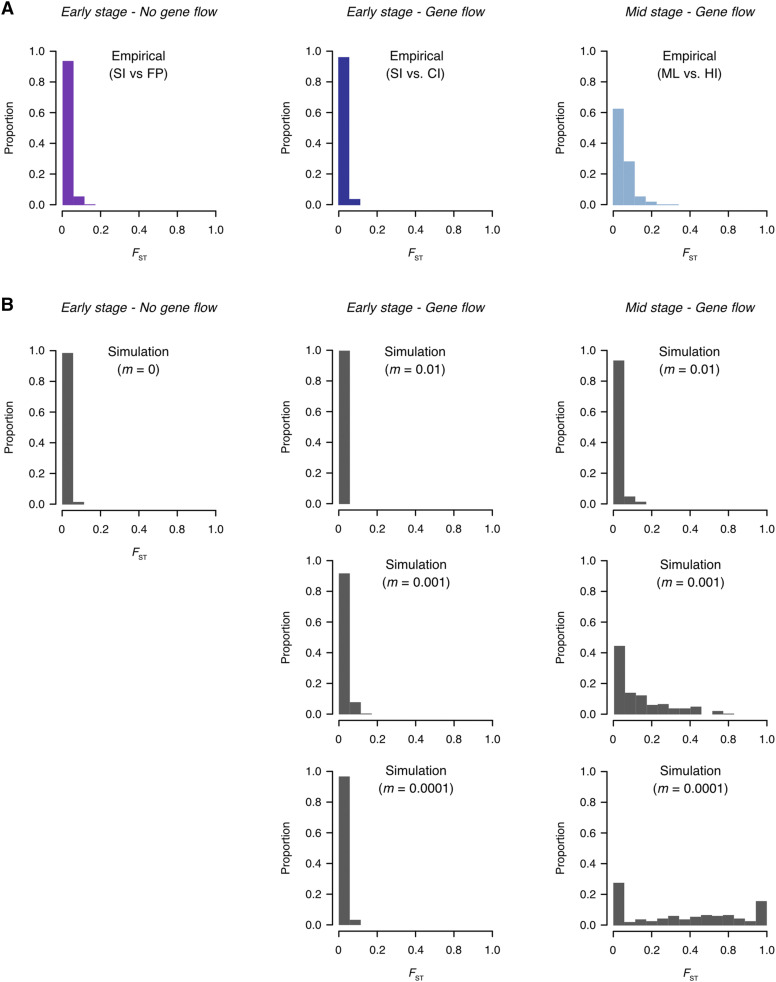
Figure 7.
Comparison of observed and simulated FST distributions. (A) Frequency distributions of pairwise differentiation (FST) for empirical data (chromosome 5 only). (B) Frequency distributions of pairwise differentiation (FST) for simulated data. The FST values are calculated in 500kb windows. Simulations were conducted using a recombination rate of 3 cM/Mb (the distance between loci for which the expected average number of intervening chromosomal crossovers in a single generation is 0.01). Simulations of divergence with gene flow were conducted under different migration rates (m = 0.01, m = 0.001, and m = 0.0001). Simulation timeframes matched that for each empirical comparison (Early stage - no gene flow: 27 generations; Early stage - gene flow: 47 generations; Mid stage - gene flow: 1,000 generations).

