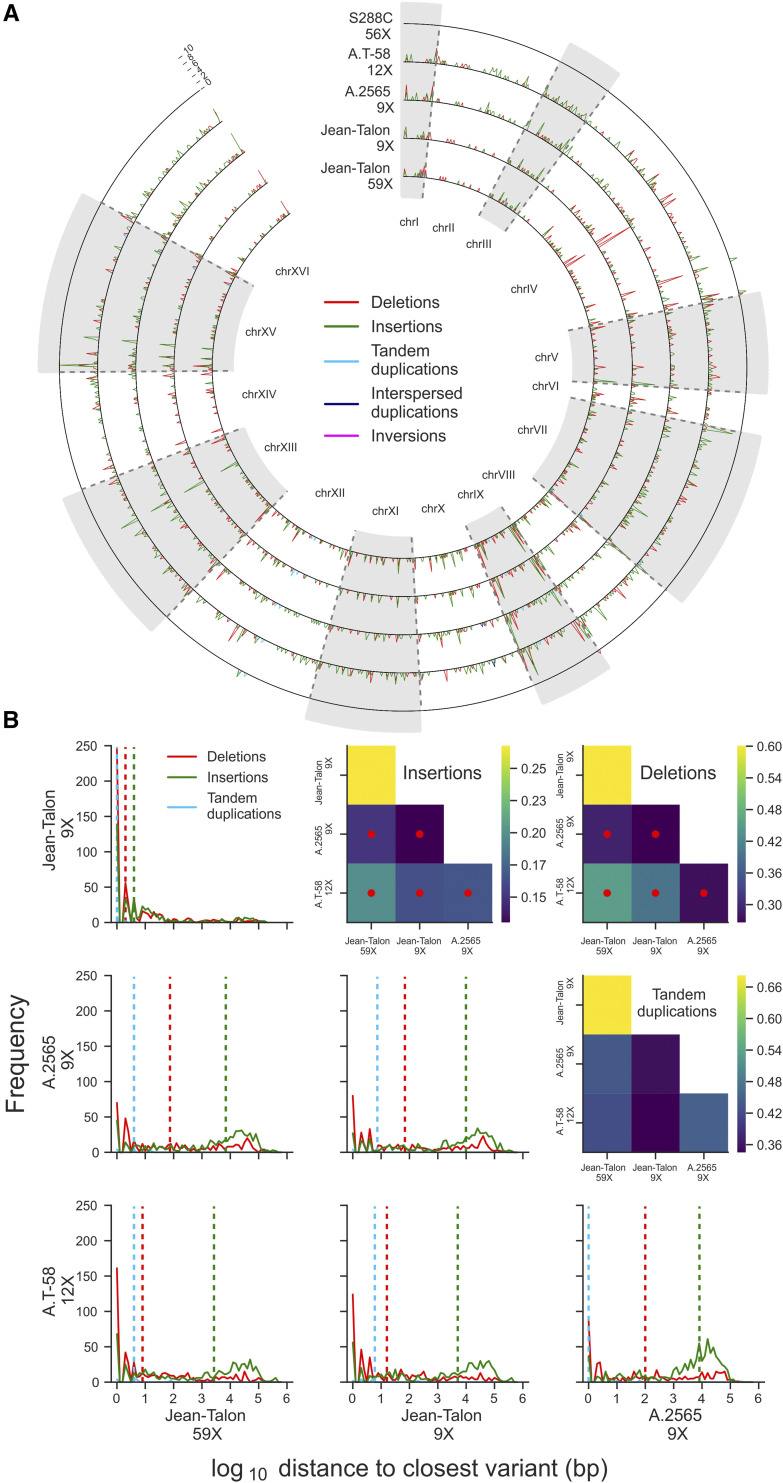
Figure 5.
Structural variation (SV) in the genome of the Jean-Talon strain. (A) SVs compared to S288C for the Jean-Talon strain (complete and subsampled datasets), and two beer strains with available long read datasets, one from the Beer/baking group (A.T-58) and one from the Ale2 group (A.2565). SV density in non-overlapping 10 kb windows is plotted. (B) Physical proximity of SV calls between strains. Distributions of physical distance to the closest same-class SV call in the mate strain is shown for each pair of strains. Dotted vertical lines correspond to medians. Heatmaps show the results of two-sided Mann-Whitney U-tests for each distribution compared to the (Jean-Talon 9X: Jean-Talon 59X) reference pair. Color maps show ratios of U statistics to the reference, while red dots indicate distributions significantly right-shifted compared to the reference (p-values < 0.05, Mann-Whitney U-tests, FDR corrected). Data and code to generate the figures is in File S1.

