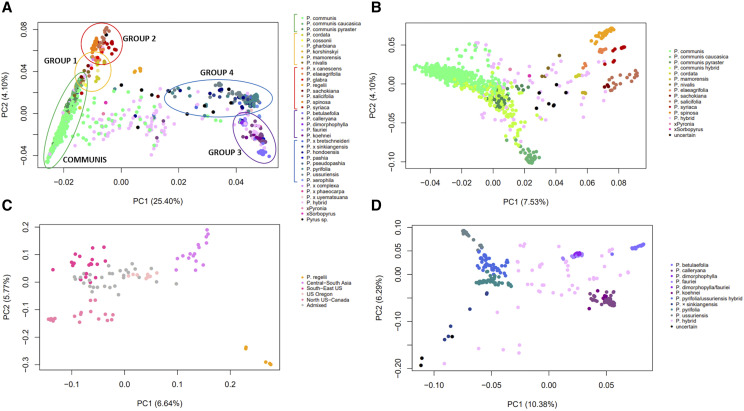
Figure 2.
Principal component analysis plots. PC1 vs. PC2 plots are shown for a) all accessions; b) Occidental accessions; c) Admixed accessions; and d) Oriental accessions. Colors are assigned based on the known species assignment for a, and on the new species assignment proposed in this study for b, c and d. The percentages of variation accounted for by each PC1 and PC2 are displayed on the axes. In plot a the major groups of species are shown with circles on the chart, and with bars on the legend.

