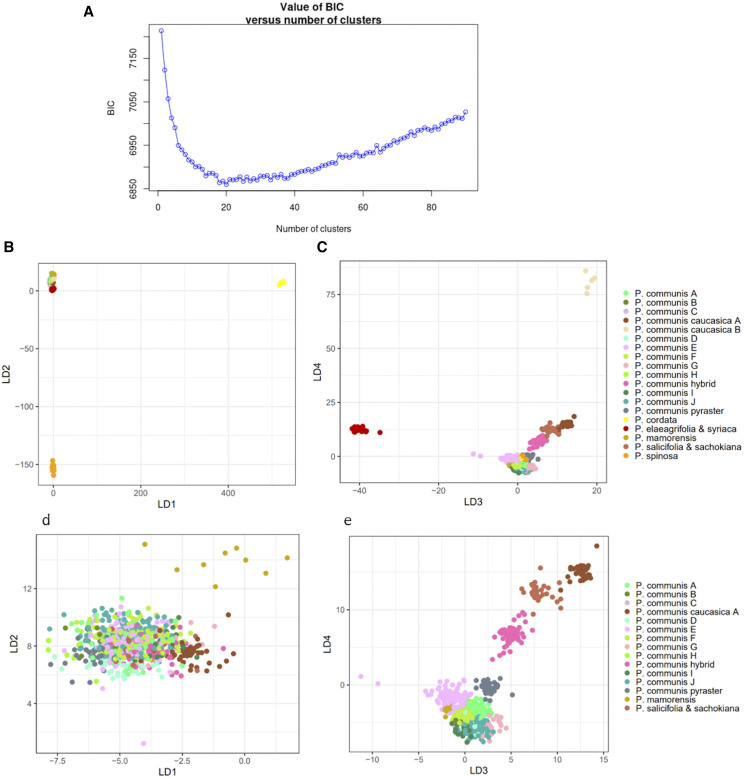
Figure 4.
Discriminant analysis of principal components (DAPC) in the Occidental group. In a) the plot of BIC values vs. number of clusters; in b) the discriminant functions 1 vs. 2 (LD1 vs. LD2) plot and in c) the LD3 vs. LD4 plot for all groups identified with the DAPC; in d) the LD1 vs. LD2 plot and in e) the LD3 vs. LD4 plots for all groups identified with the DAPC excluding P. cordata, P. spinosa, P communis caucasica B and P. elaeagrifolia & syriaca.

