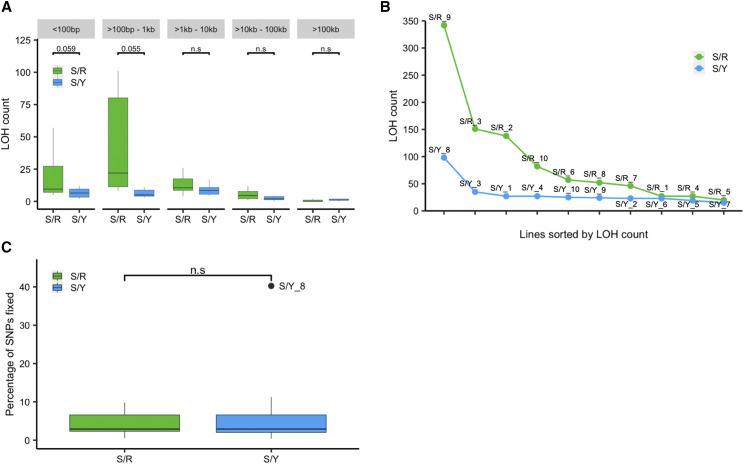
Figure 3.
Analysis of LOH in S/Y and S/R hybrids. A) Box plot showing the number of LOH tracts (supported by two or more SNPs) among different classes of LOH tract sizes in S/Y and S/R hybrids. Outliers are removed. Non-significant differences are shown as n.s (t-test). B) Individual S/Y and S/R lines sorted based on the number of LOH counts (supported by two or more SNPs). C) Percentage of SNPs fixed relative to the number of heterozygous SNP positions in the S/R and S/Y hybrids. n.s indicates non-significant (t-test).

