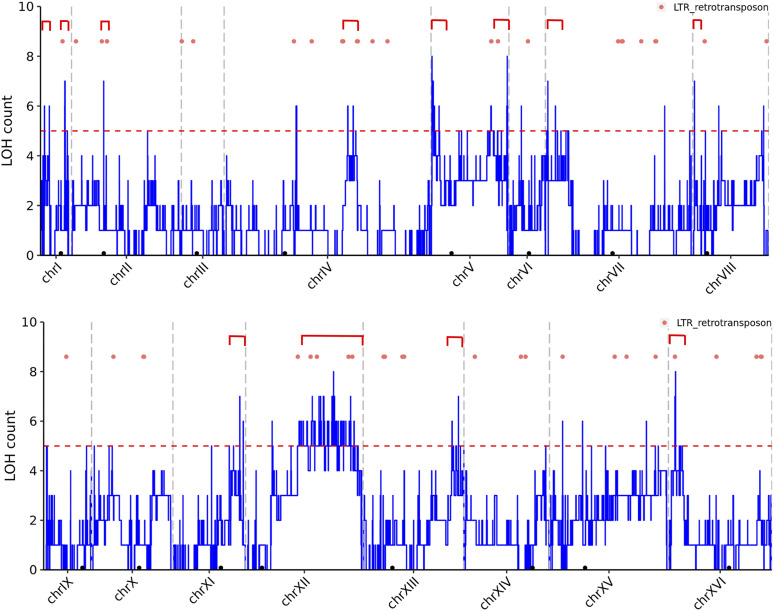
Figure 4.
Chromosomal map of LOH for S. cerevisiae S288c strain. Total count of LOH tracts from 15 S/Y (includes data from 5 S/Y hybrids from Dutta et al. 2017) and 10 S/R hybrids with their positions on each chromosome. Centromeres are shown in black dots. Chromosome boundaries are shown in gray vertical dash lines. Dash red lines show LOH count of 5 (shared in 20% of the lines). LOH hotspots are shown in red rectangle brackets. Orange dots show LTR retrotransposon positions.

