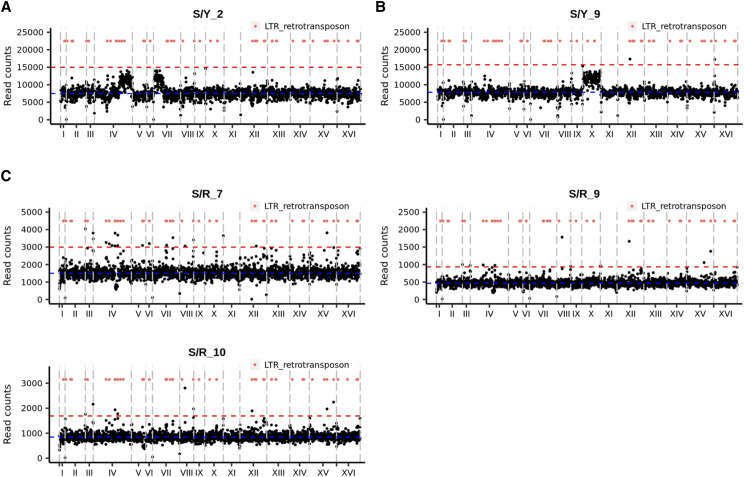
Figure 5.
Analysis of gross chromosomal changes in S/Y and S/R hybrids. A) Segmental duplications (Chromosomes IV and VII) in S/Y_2. B) Chromosome X aneuploidy in S/Y_9. C) Segmental deletions in S/R_7, S/R_9, and S/R_10. Gray vertical lines show chromosomal boundaries. Horizontal blue and red lines show the median and 2x median read counts that map to the chromosomes respectively. Orange dots show LTR retrotransposon positions in all panels.

