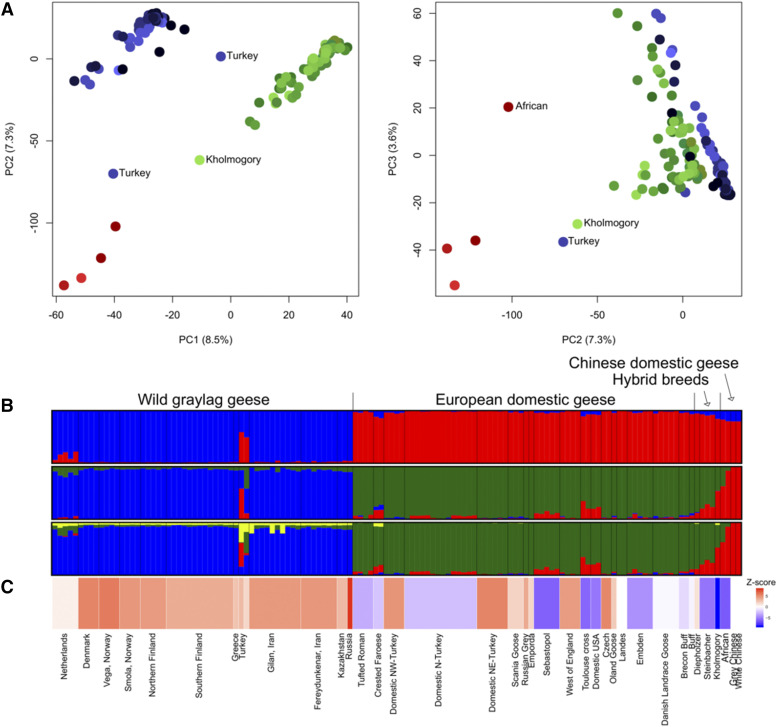
Figure 3.
The genetic divergence and hybridization patterns in graylag and domestic geese. Population status and names labeled as in Supplementary File 1, Table S1. The colors in A) and B) are associated to different groups as follows: graylags (blue), European domestics (green) and Chinese domestics (red). A) The first three principal components summarizing the genetic variation in geese (percentage explained by each PC is shown). Different shades refer to different populations. B) STRUCTURE assignment plots for K = 2, K = 3, and K = 4. Each vertical bar represents one individual with K number of colors indicating proportion of ancestry from the inferred clusters, and populations/breeds are separated by black vertical line. C) Plot relating to the f3 (Supplementary File 1, Table S5) values obtained for each population. Turkey refers to two adjacent bars in the plot since the Turkish graylags were analyzed as two separate individuals. The more negative the f3, the more significant is Z-score in favor of admixture. The f3 values were not calculated for Landes and the Chinese geese, as they were used as source populations, thus they were given an f3 value of 0.

