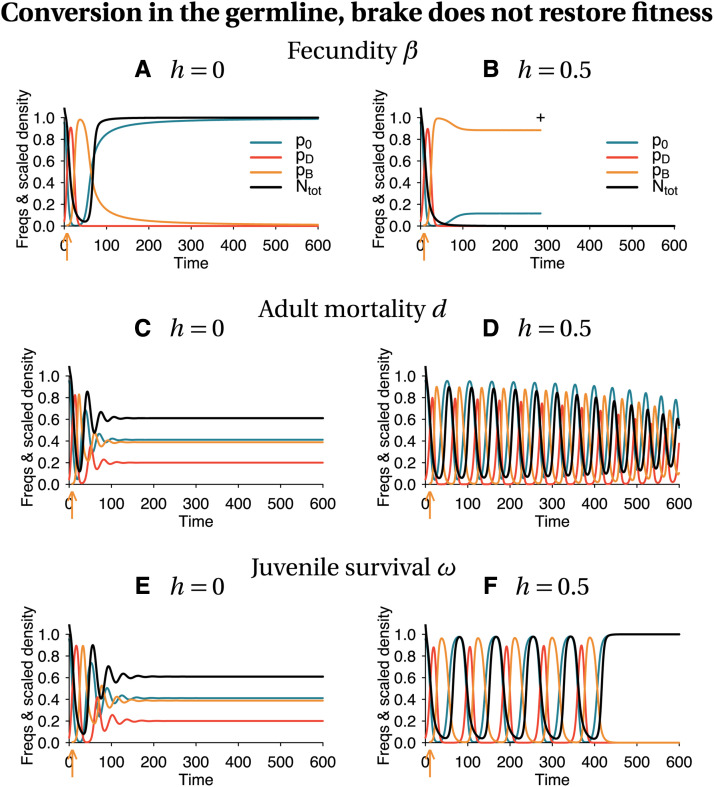
Figure 2.
Deterministic dynamics of the frequencies of each allele in the population, and scaled total population size (black curve). Conversion takes place in the germline, and the brake does not restore fitness. Population size is scaled relative to the equilibrium size of a 100% wild-type population . The arrow indicates the timing of drive introduction, here chosen to be when the drive allele is at 50% (f_I = 0.5). A cross indicates population extinction. Simulation parameters are listed in Tables S1–S3.

