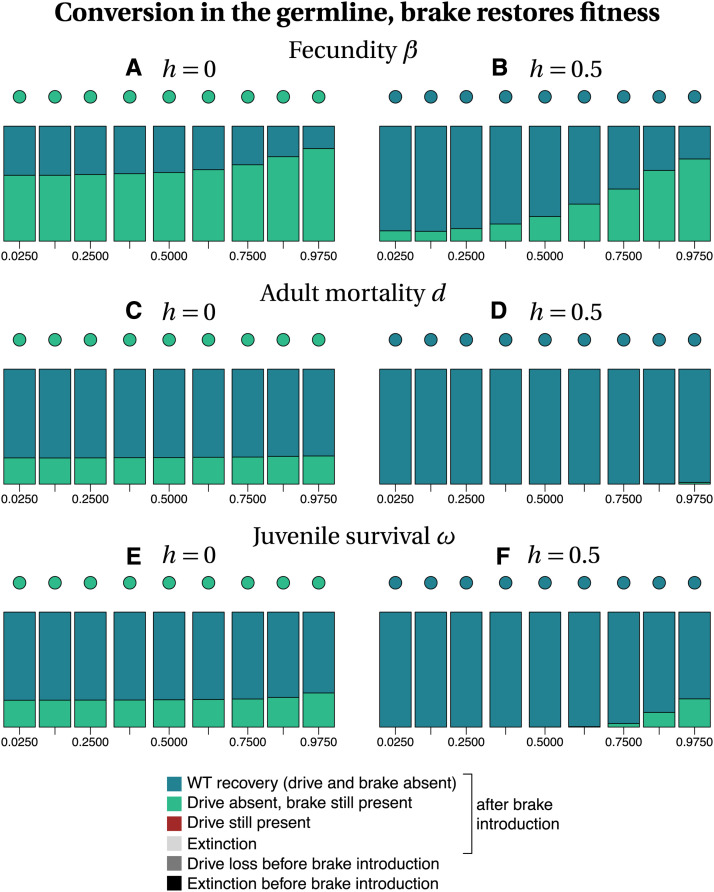
Figure 4.
Frequency of each type of outcome in the simulations (color-coded), depending on the frequency of drive f_I at the time at which the brake is introduced (horizontal axis), on the dominance coefficient h (columns) and on the trait that is affected by the drive and the brake (rows). The dots show, with the same color code, the output of the deterministic model. Simulation parameters are listed in Tables S1–S3.

