Figure 3.
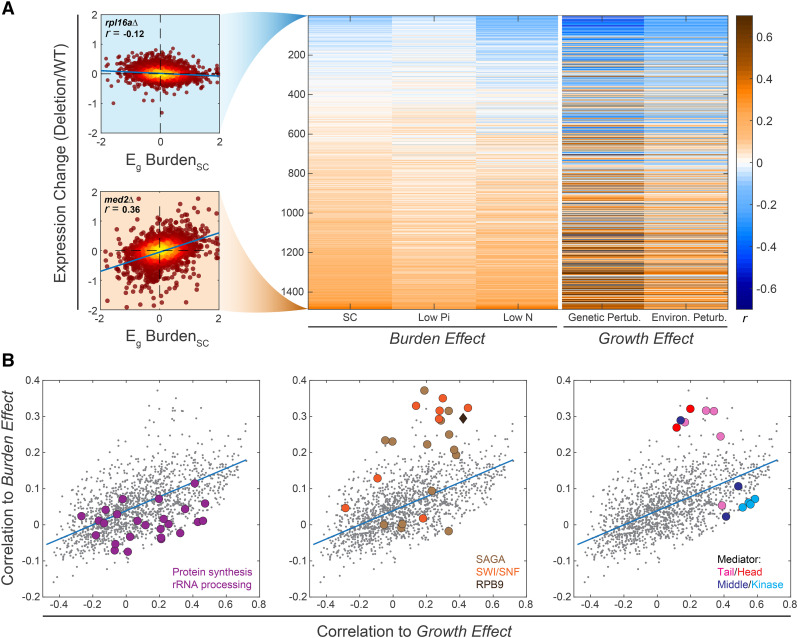
Transcription signature of burdened cells correlates with that of transcription-perturbing mutants: (A) Correlations between the burden response and the transcription response to gene-deletion mutants: Shown are the Pearson r correlations between the growth-rate response Eg (measured in the indicated dataset and condition, FileS4), with the transcription signature of each individual gene-deletion mutant. Mutants are ordered by the correlation values with the burden response, averaged over the three conditions. Specific mutants are highlighted, as indicated (see also Figure S3A). (B) Distinguishing mutants that correlate specifically with the burden response: Correlations between mutant signature and burden response (as in A, averaged over the three conditions) are plotted as a function of the correlations between mutant signature and growth-rate response (as in A, averaged over the genetic and environmental responses). Each dot is a mutant, color-coded as indicated. See also Figure S3B.

