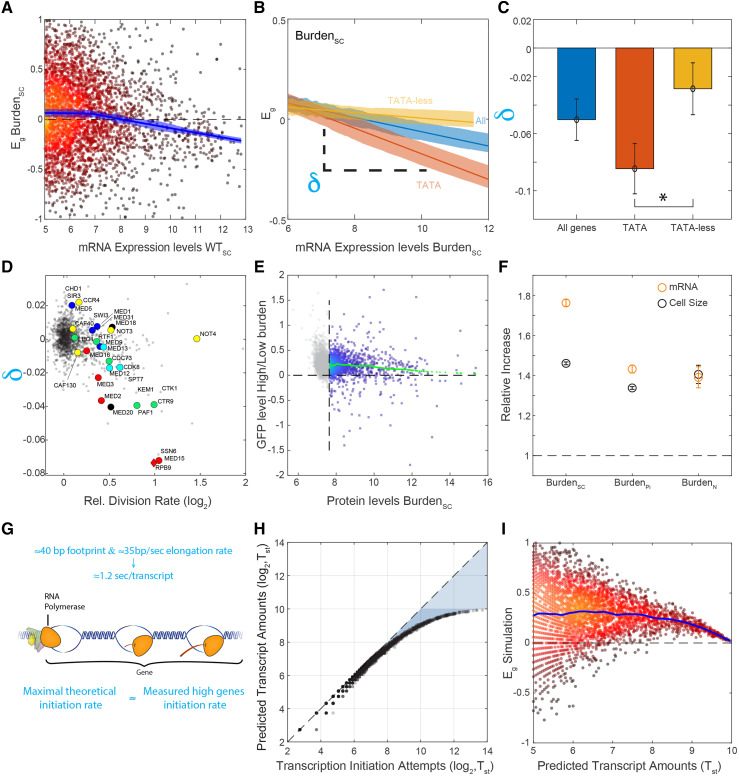
Figure 5.
Transcription-promoting feedback activated in burden cells: (A-C) Relative expression of high-abundance genes tends to decrease in burdened cells: Shown are the relative changes in gene expression in burdened cells as a function of absolute mRNA abundance in wild-type cells (A). This effect is accentuated in TATA containing genes (B), with the lines showing the linear fit and the shading the SEM. The expression-dependent bias was quantified by the slopes (δ) of these dependencies. Averaged values of this bias, calculated in the different datasets, are also shown (C). Error bars represent SEM. (D) Mutant strains preferentially affect highly-expressed, TATA-containing genes: The expression-dependent bias (δ) was calculated for each deletion mutant, as in B. Shown are the values of this bias as a function of the mutant growth rate. Genes associated with transcription initiation and elongation are marked. (E) Cells burdened with mCherry production increase their endogenous protein levels: Shown are individual measurements of each protein-GFP fusion in the GFP library in the high burden strain vs. low burden. The mean increase in GFP across all informative proteins (above the detection limit marked by the vertical dashed line) is ≈15%. Smoothed data are shown in green using Lowess (malowess, MATLAB 2018a). (F) Burdened cells increase the overall amounts of endogenous transcripts: The total amount of mRNA was measured using sequencing, calibrated by an external spike-in reference. Values from the literature are indicated; see text for details. (G) The maximal possible limit of transcription initiation rate: A new initiation event can only occur once the polymerase has elongated away from its initiation site. This elongation rate, therefore, defines an upper bound on the possible rates of transcription initiation. (H-I) Simulation of the transcription initiation process: The model assumes that initiation attempts are stochastic, characterized by some attempt rate. An attempt is deemed successful if it occurs at a sufficient delay from a previous successful attempt. This delay corresponds to the time required for the polymerase to clear the initiation site. Shown is the frequency of successful initiation events as a function of the attempt rate (H). The consequence of increasing the frequency of the overall attempts, as we assume it happens in burdened cells, is shown in (I), where the blue line is cubic smoothing spline. Note the limited efficiency of this feedback at genes transcribed at high rates.

