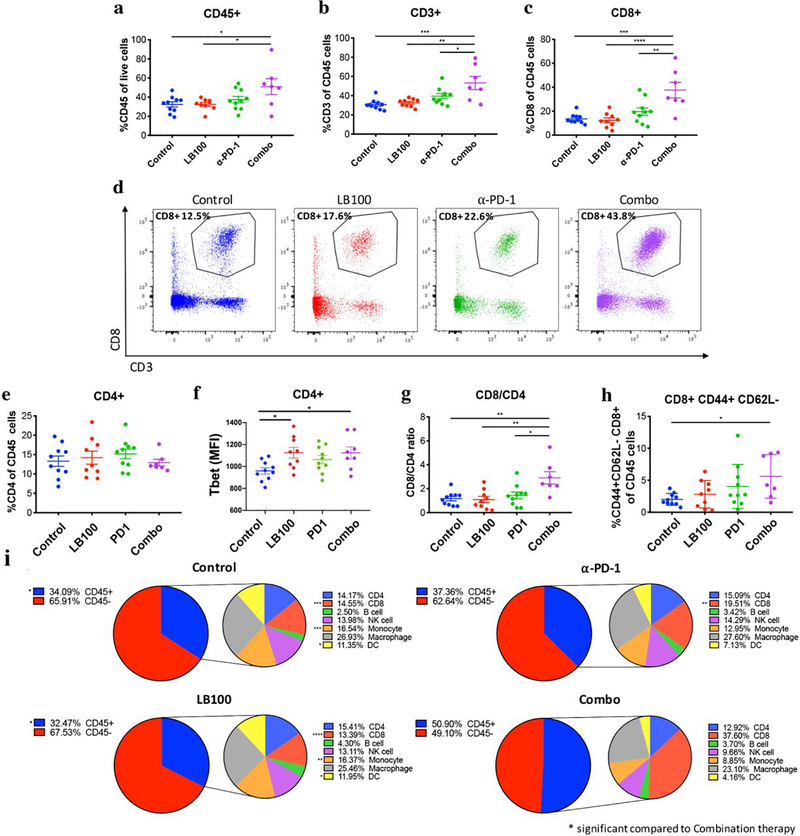
Fig. 4. LB-100 and PD1 blockade increase CD8+ infiltration and activation.
Tumors the respective groups were harvested after 4 treatment cycles and analyzed by flow cytometry. (a) CD45+ cells as a percentage of live cells were significantly increased in combination compared to control and LB-100 alone. (b) CD3+ and (c) CD8+ cells as a percentage of CD45+ cells were significantly increased in combination compared to control or single treatments. (d) Representative FACS plots of CD8+ CD3+ T cells. (e) CD4+ cells as a percentage of CD45+ cells were not significantly changed. (f) Expression of Tbet by CD4+ cells were significantly increased in LB-100 alone and combination group compared to control. Tbet expression was measured by geometric Mean Fluorescent Intensity (MFI) in CD4+ cells. (g) Ratios of CD8+ to CD4+ T cells were significantly increased in combination compared to control or single treatment groups. (h) CD44+ CD62L- CD8+ T cells expressed were significantly increased in combination compared to control. (i) Summary of CD45+ immune cell subsets and CD45- cells. Subsets are depicted as percentage of all acquired live events (left) and CD45+ cells (right). Diagram on the right: CD4+ (blue; CD45+ CD3+ CD4+), CD8+ (red, CD45+ CD3+ CD8+), B cell (green; CD45+ CD19+), NK cell (purple; CD45+ CD161+), Monocyte (orange; CD45+ CD3- CD11clow CD11b+ Ly6G- Ly6Chigh), Macrophage (grey; CD45+ CD3- CD11clow CD11b+ Ly6G- Ly6Clow), DC (yellow; CD45+ CD11chigh). Experiments were duplicated with 4 mice per arm. The combined data was presented. *P<0.05, **P<0.01, ***P<0.001, ****P<0.0001 (one-way ANOVA with Tukey’s multiple comparison test)

