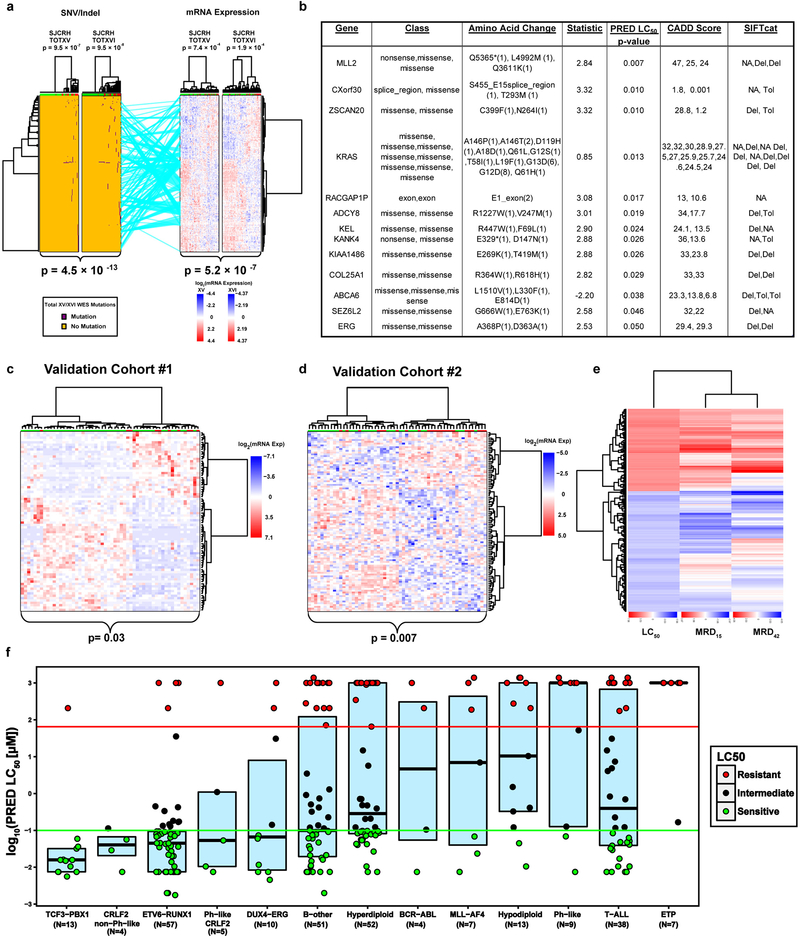
Extended Data Fig. 2. Validation of gene expression signature, relation to treatment response and WES variant connectivity.
(a.) Connectivity between polygenomic signatures for mutation (n=227 mutations) and mRNA expression (n=254 mRNA probes; Fisher’s Exact Test clustering p-values and linear model p-value for connectivity). (b.) Characteristics of WES mutations with linear model p-value <0.05 vs. LC50. (SIFTcat Del = Deleterious and Tol = Tolerated). (c.) RNA sequencing of ALL cells from St. Jude Total XVI patients (n=73 patients; validation cohort #1; Fisher’s Exact Test clustering p-value) clustered with gene expression signature from discovery cohort analysis. (d.) Publicly available DCOG/COALL patient cohort (n=145 patients; validation cohort #2; Fisher’s Exact Test clustering p-value) clustering with gene expression signature from patient discovery cohort. (e.) Clustering of gene expression vs. LC50. Red denotes genes correlated with LC50 or minimal residual disease (MRD) in positive direction. Blue denotes genes correlated in negative direction with LC50 or MRD. Clustering performed to show concordance of genes discriminating LC50 or MRD. (f) Boxplot denoting Prednisolone LC50 in patients from discovery cohort with the major ALL molecular subtypes. Red circles denote prednisolone resistant patients, green denotes sensitive patients, and black denotes intermediate sensitivity. Upper line is the upper quartile (75%) middle line is the median and lower line is lower quartile (25%) boundary for Prednisolone LC50.

