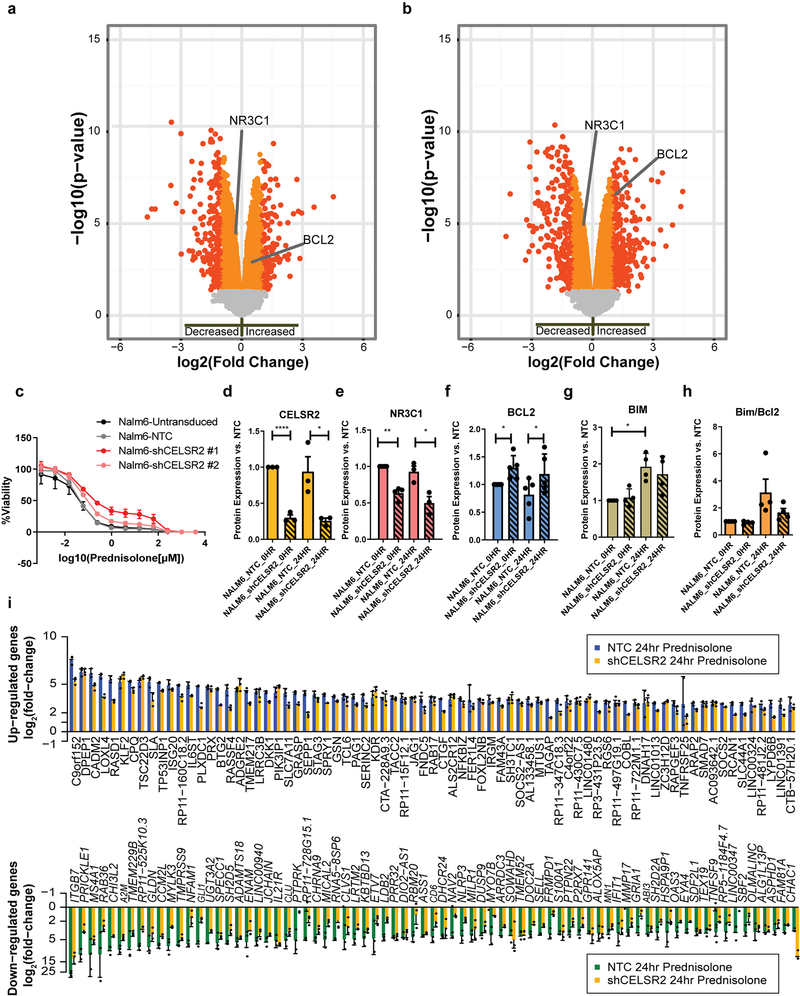
Extended Data Fig. 4. CELSR2 knockdown blunts glucocorticoid responsiveness of 697 cells and increases sensitivity to venetoclax.
(a.) Volcano plot for untreated CELSR2 knockdown ALL cell lines vs. non-target control in 697 cell line (n= 3 independent experiments; linear model p-value). Left side of plot depicts genes with reduced expression in CELSR2 knockdown cells and genes to the right had increased in expression in CELSR2 knockdown cells. (b.) Volcano plot of gene expression after 24 hours of prednisolone treatment of CELSR2 knockdown vs. non-target control ALL cells (697; n= 3 independent experiments; linear model p-value). (c.) Dose-response plot (mean ± S.D.; n= 3 independent experiments) of two shRNA constructs vs non-targeting control and un-transduced NALM-6 leukemia cell line. (d.) CELSR2 (n= 3 independent experiments) (e.) NR3C1 (n= 4 independent experiments) (f.) BCL2 (n=5 independent experiments) (g.) BIM (n= 4 independent experiments) and (h.) Bim/Bcl2 protein expression (mean ± S.D; n=4 independent experiments; two-tailed t-test p-values; * =p < 0.05, ** = p <0.01, *** = p <0.001, **** = p <0.0001) in NALM-6 cells comparing controls (NTC; solid bars) to CELSR2-knockdown (shCELSR2) either prior to prednisolone treatment (0HR) or after 24hr prednisolone treatment (24HR). (i.) The 75 most highly upregulated (top) or downregulated (bottom) genes after 24 hours treatment with 10μM prednisolone. Blue and green bars depict mRNA expression (mean ± S.D.; n= 3 independent experiments) in 697 cells transfected with non-target control vector and gold bars depict cells expressing shRNA for CELSR2 knockdown.

