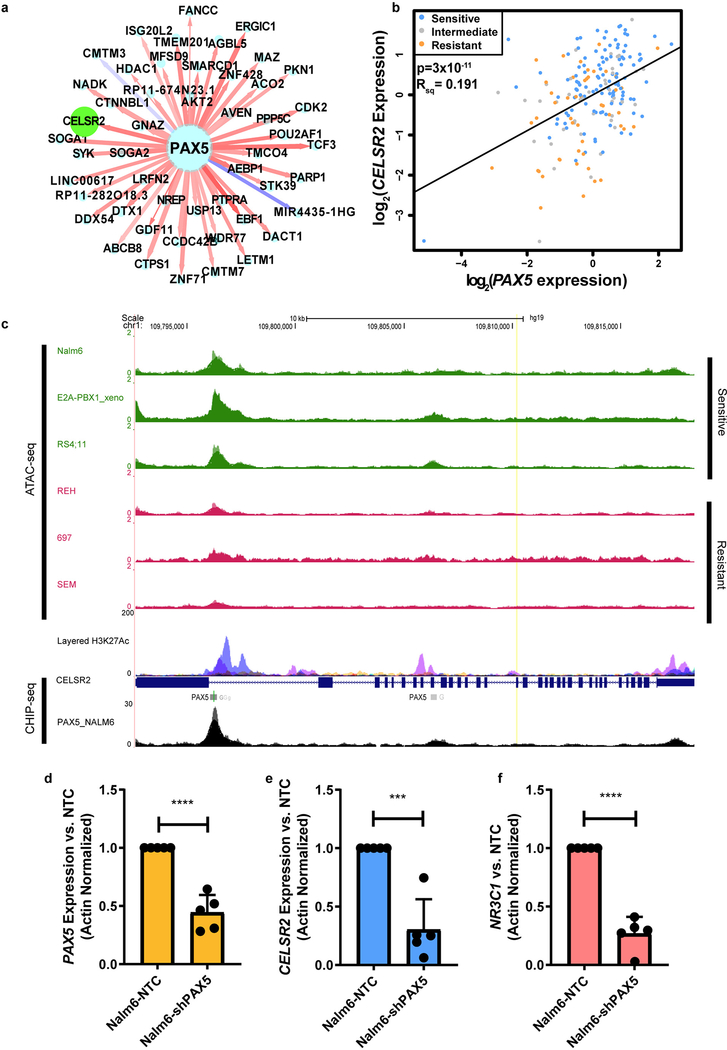
Extended Data Fig. 7. CELSR2 mRNA expression is related to PAX5 expression in primary ALL cells.
(a.) Subnetwork (top 50 interactions ranked by mutual information) of PAX5 and CELSR2 from BALLi (n=185 patients). Legends of node and edge follow Figure 6c, except that nodes in green are those in top 48 drivers (Figure 6b). (b.) CELSR2 expression positively correlates with PAX5 expression in primary acute lymphoblastic leukemia cells (n= 203 patients; black line represents regression fit associated with linear model p-value and Rsq). (c.) Open chromatin regions defined by ATAC-seq (n=2 independent experiments) in three sensitive and three resistant human leukemia cell lines and H3K27 acetylation from ENCODE in upstream 5’ region of CELSR2. ENCODE binding site in GM12878 lymphoid cells for PAX5 and CHIP-seq peaks from NALM-6 cells for PAX5 binding are indicated at bottom of the plot. (d) PAX5 (**** = 3.5×10⁻⁵) (e.) CELSR2 (*** = 3.0×10⁻⁴) (f.) NR3C1(**** = 3.2×10⁻⁵) protein expression (mean ± S.D.) in NALM-6 leukemia cell lines stably expressing shRNA knockdown constructs targeting PAX5 (for d-f n=5 independent experiments; two-tailed t-test p-values).

