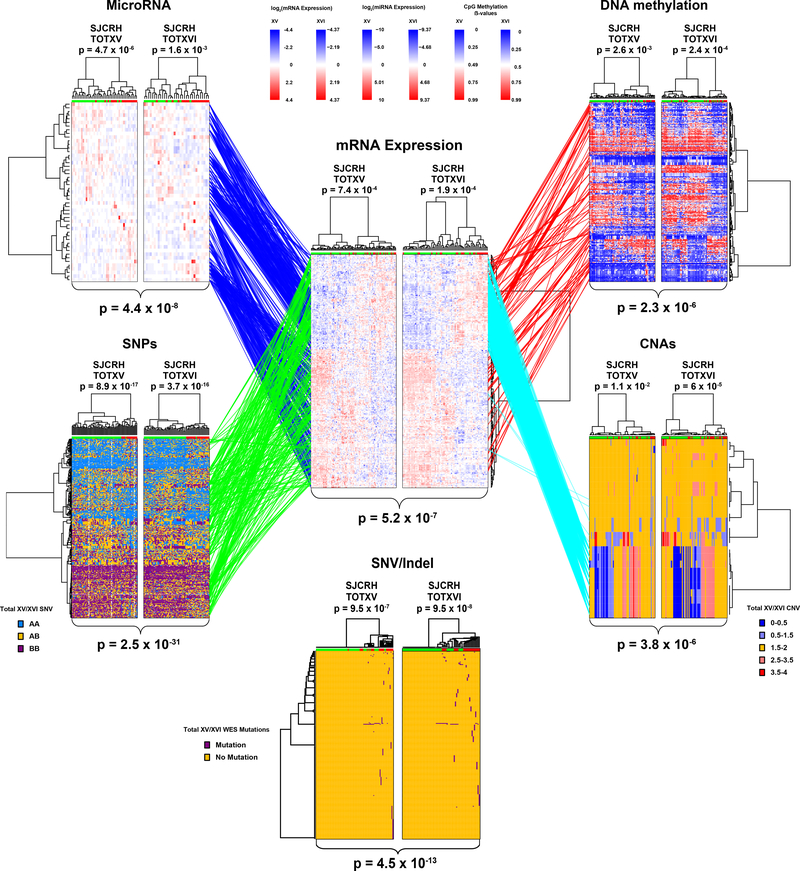
Figure 2: Polygenomic analyses identify genomic features related to prednisolone resistance.
Leukemia cell mRNA, miRNA, DNA methylation, copy number alterations (CNAs), single nucleotide polymorphisms (SNPs) or coding SNVs/Indels (by WES) that significantly discriminate prednisolone sensitive and resistant ALL, by hierarchical clustering in the discovery cohorts (TOTXV and TOTXVI). Each column represents an individual patient’s ALL cells, those labeled at the top with green are sensitive and those with red are resistant to prednisolone; each row indicates a different probe. (Center panel) mRNA expression vs prednisolone LC50: heat map depicts high (red) or low (blue) gene expression relative to the mean signal for that probe set in the entire cohort [n=254 mRNA probes; n= 203 patients]. (Top left) heat map for miRNA expression versus LC50; red and blue denote higher versus lower expression relative to mean signal for probe amongst the entire cohort [n=49 miRNAs; n=163 patients]. (Top Right) DNA methylation versus LC50; red and blue denote higher versus lower methylation signal [n=203 CpG probes; n=178 patients] (Bottom left) single nucleotide polymorphisms (SNPs) associated with LC50 blue = AA, orange = AB, purple = BB [n=380 SNPs; n=184 patients]. (Bottom right) copy number alterations (CNAs) associated with LC50; red = copy gain, blue = copy loss, orange = copy neutral [n=25 CNAs; n= 184 patients]. (Bottom center) SNVs and Indels by WES [n=227 SNVs/Indels] associated with LC50; purple = mutation, orange = non-mutated. (Lines) lines connecting probe sets are drawn where significant associations were found between mRNA expression levels and a specific peripheral genomic feature. DNA methylation and miRNA connections were required to be significantly negatively associated with mRNA expression; DNA methylation probes were also required to be within 100kb of the gene encoding the mRNA and miRNAs were required to have a predicted binding site in the gene and/or experimental evidence from literature. Connections between SNVs/Indels and mRNA are provided in Extended Data Fig. 2d. P-values for each heatmap (at top) indicate the results of Fisher’s exact tests comparing the distribution of sensitive and resistant cases when the highest level of the dendrogram is split in two. Overall clustering P-values for each heatmap (at bottom) are the result of Stouffer’s meta-analysis of corresponding individual Fisher’s exact test (two-sided) p-values within each cohort.

