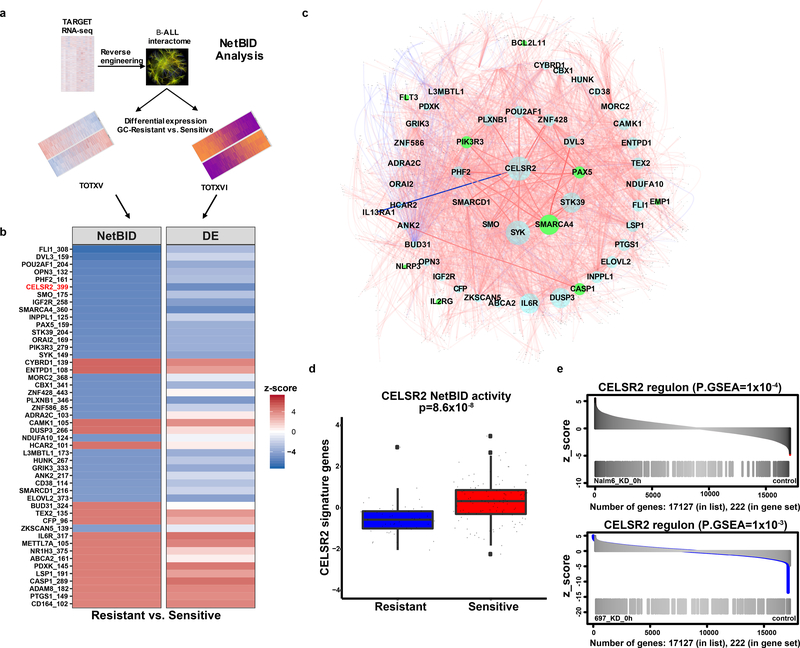
Figure 6. NetBID identifies CELSR2 as a hub driver of prednisolone resistance.
(a.) Schematic workflow representing NetBID algorithm (b.) Heatmap of top 48 NetBID-predicted drivers from total of n=7,920 drivers inferred from the B-ALL interactome (n=185 patients) that were associated with prednisolone resistance (n=203 patients with gene expression and LC50). Drivers (as denoted by “symbol_regulon size”, e.g. “CELSR2_399”) are ranked by integrated NetBID p-value. (Left) Combined NetBID results color-coded by z-score (red = positive, blue = negative); Right: differential expression (DE) of each driver itself, color-coded by z-score. (c.) Subnetwork of the top 48 drivers versus prednisolone LC50 in relation to one another (limited to top 50 interactions for each driver ranked by mutual information of each hub gene) from B-ALLi. Node size is proportional to the regulon size; nodes in green represent known resistance genes. Edges: width is proportional to mutual information, red is for positive and blue for negative Spearman correlations of the connecting nodes. (d.) CELSR2 NetBID activities (horizontal bar depicts median and boxes represent 25th and 75th percentiles, whiskers represent ±1.5x IQR) in prednisolone resistant and sensitive patients from TOTXV and TOTXVI patient cohorts (Stouffer’s combined Bayesian generalized linear model “NetBID” p-value; n=203 patients). (e.) Enrichment of NetBID-inferred CELSR2 regulon (n= 399 genes) in differentially expressed genes (n= 222 genes) of CELSR2 knockdown vs. control in NALM-6 (top) and 697 (bottom) cell lines without prednisolone treatment.

