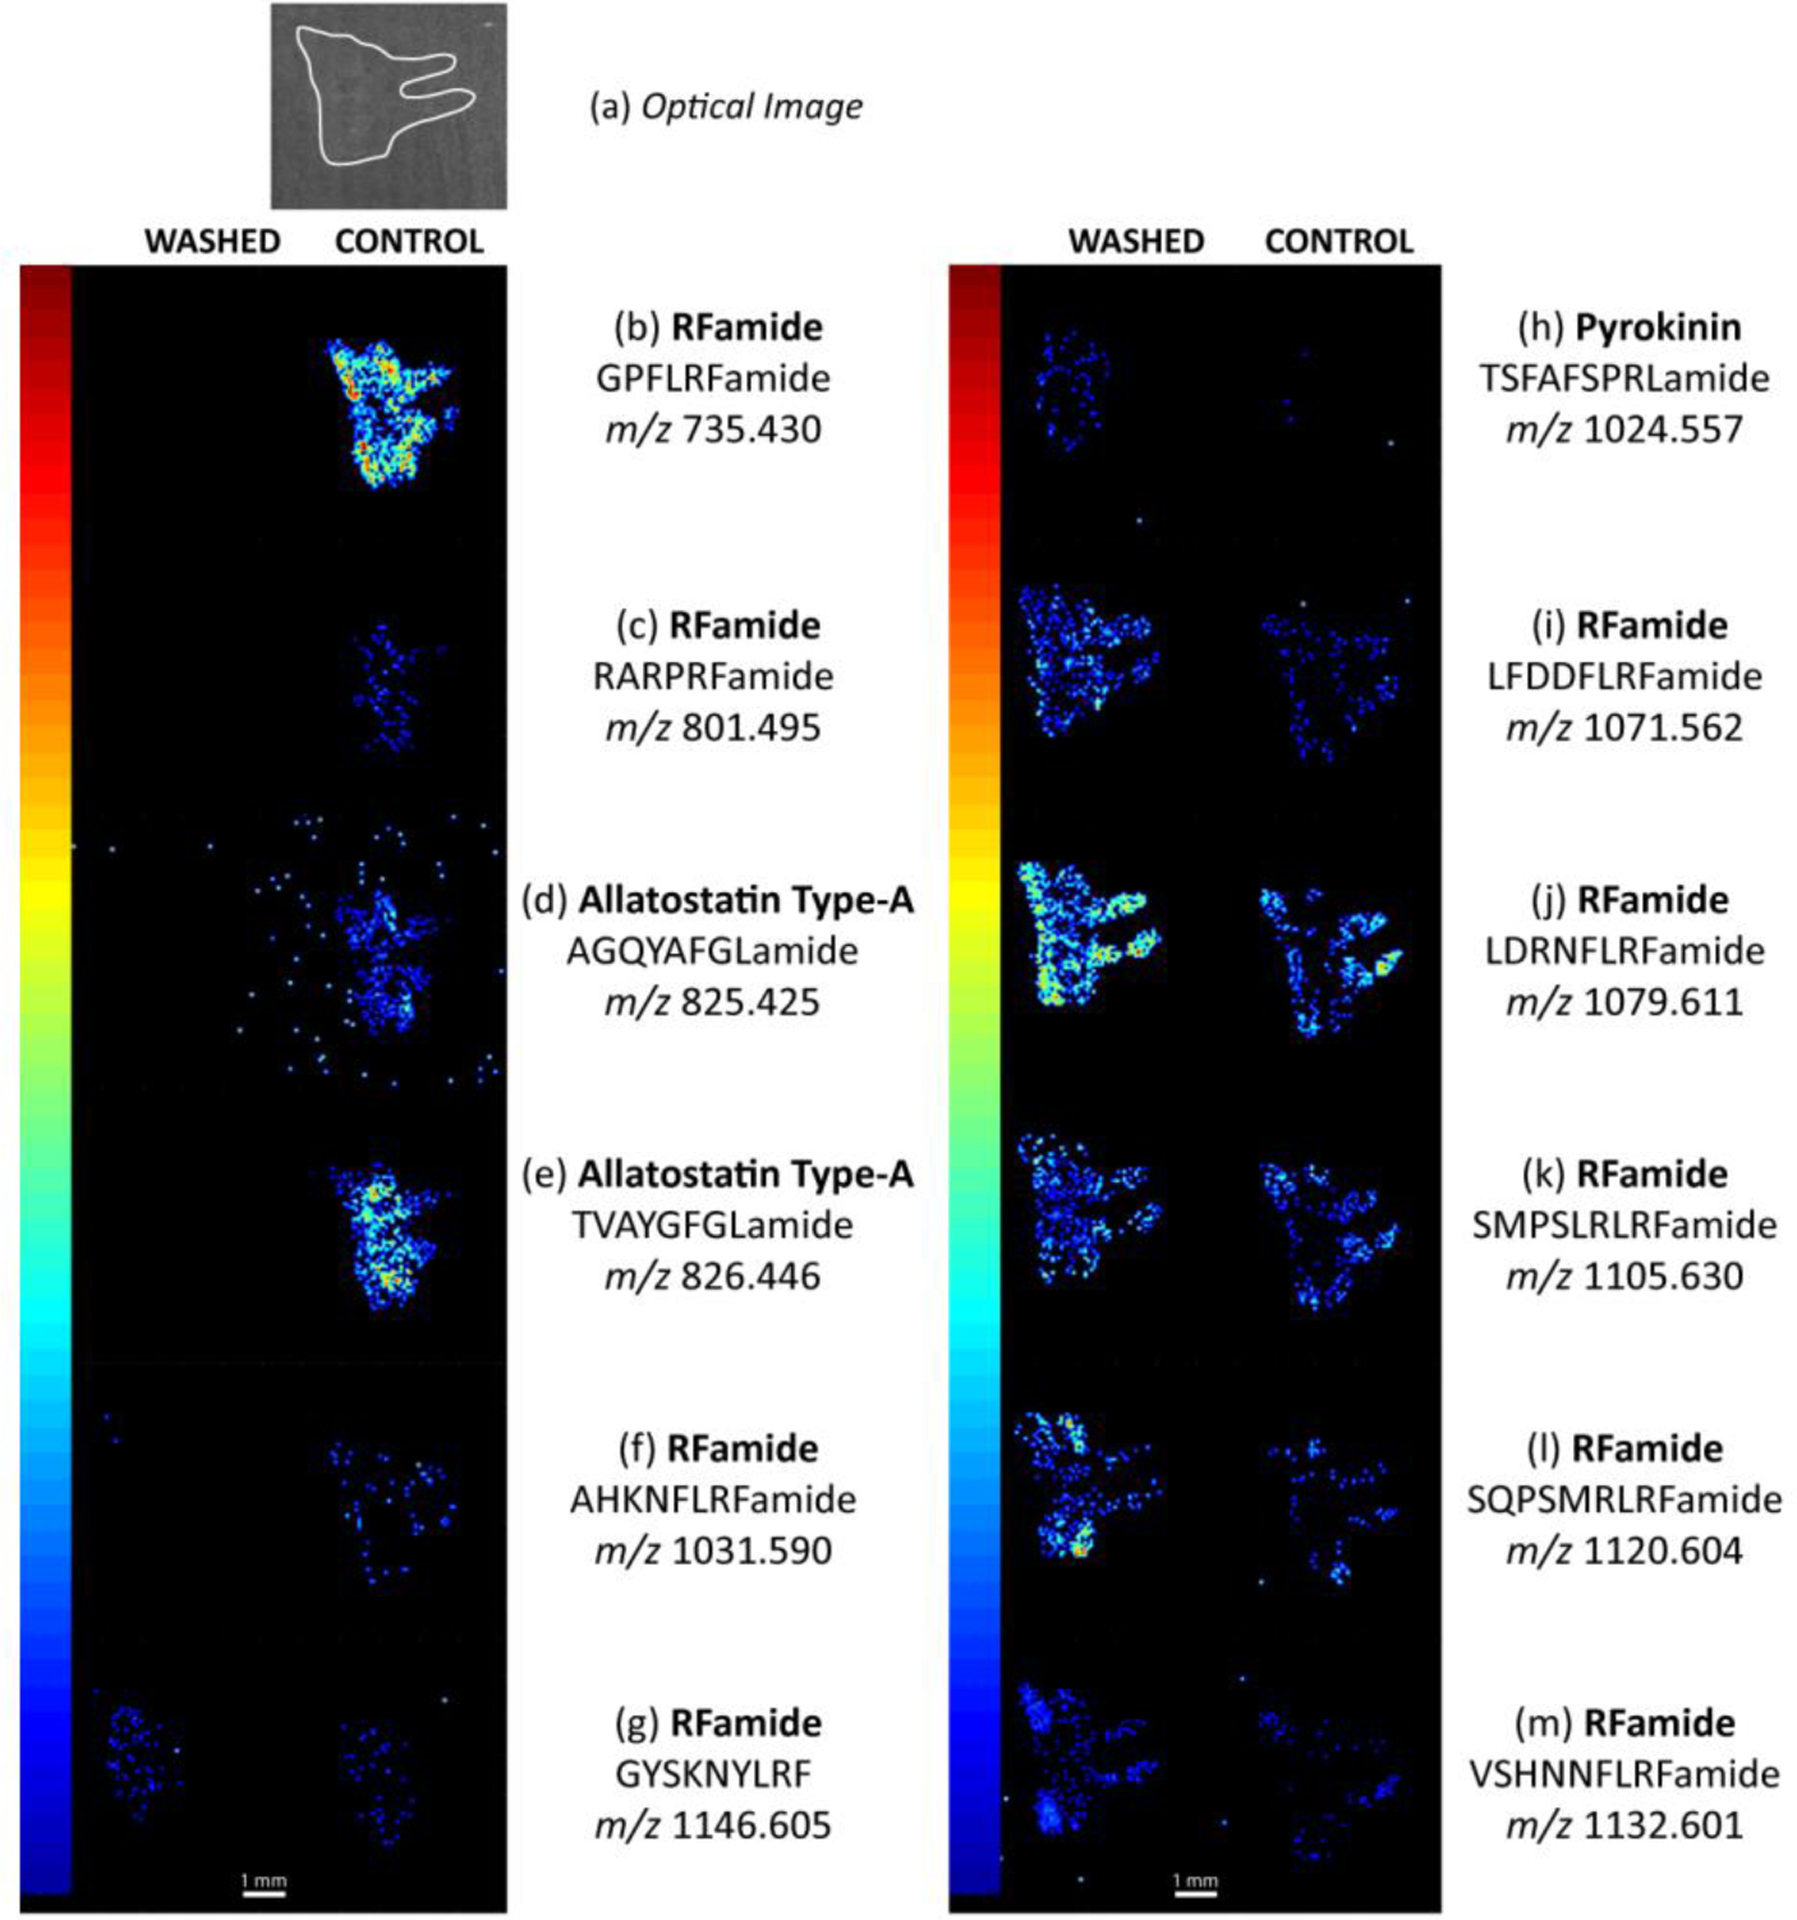
Figure 3.

Examples of neuropeptide image changes due to the wash step in serial sections of a crustacean brain. (a) An optical image of the crustacean brain, outlined in white. The elongated tubes point towards the commissural ganglion of the crustacean nervous system. (b)-(f) Crustacean neuropeptides that were removed due to the washing step. (g) A neuropeptide image example that did not have a change in intensity or localization due to the washing step. (h)-(m) Neuropeptides that had a clear signal increase due to the washing step. All washed-control comparisons are generated at the same TIC normalized signal intensity level (0 to (b) 1.82×10⁻³, (c) 2.40×10⁻³, (d) 3.00×10⁻³, (e) 2.07×10⁻³, (f) 1.15×10⁻³, (g) 2.38×10⁻³, (h) 1.96×10⁻³, (i) 2.55×10⁻³, (j) 1.27×10⁻³, (k) 2.05×10⁻³, (l) 1.18×10⁻³, (m) 3.34×10⁻³). The white line represents a 1 mm scale bar.
