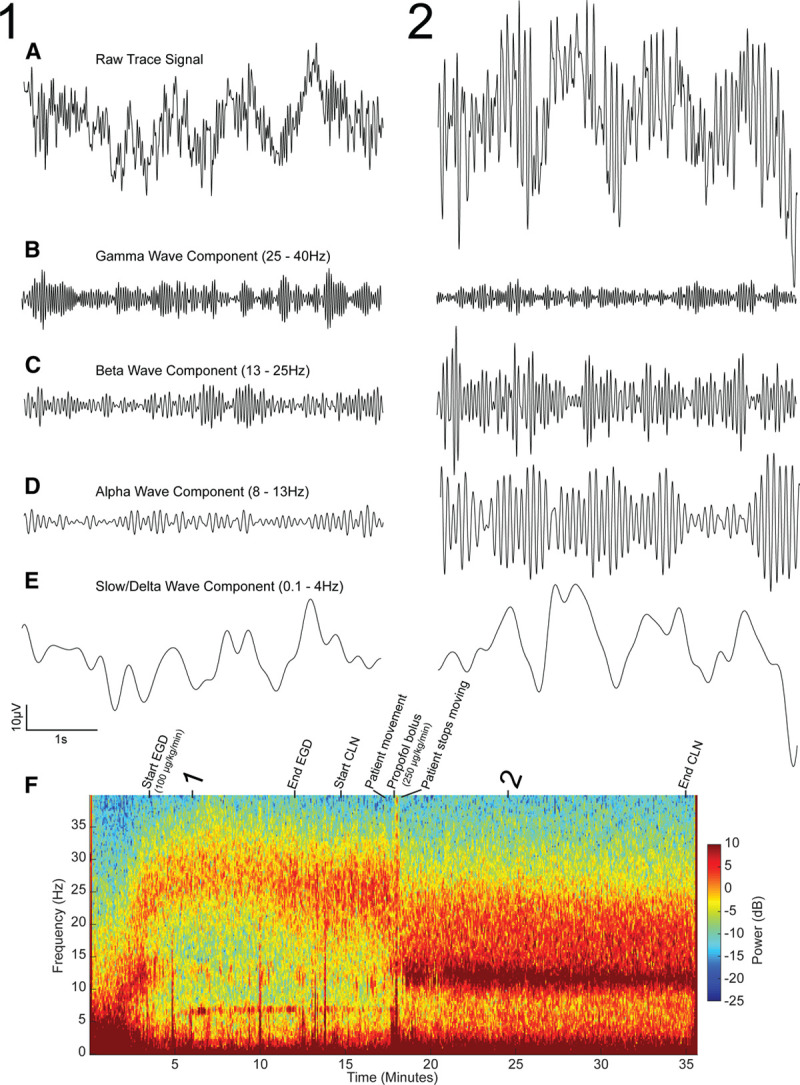
Figure 2.

The data presented for the first case involving the 2-year-old patient receiving propofol anesthesia. Representative raw trace signals from timepoints 1 (sedated state) and 2 (fully unconscious state) (A). Bandpass filtered components of the EEG signal presented in A in the gamma (25–40 Hz), beta (13–25 Hz), alpha (8–13 Hz), and slow/delta (0.1–4 Hz) ranges, respectively (B–E). The spectrogram for the full case annotated with procedural events (F). The downward trend in peak frequency into the alpha range tracks the behavioral state of the patient throughout the procedure. CLN indicates colonoscopy; EEG, electroencephalogram; EGD, endoscopy.
