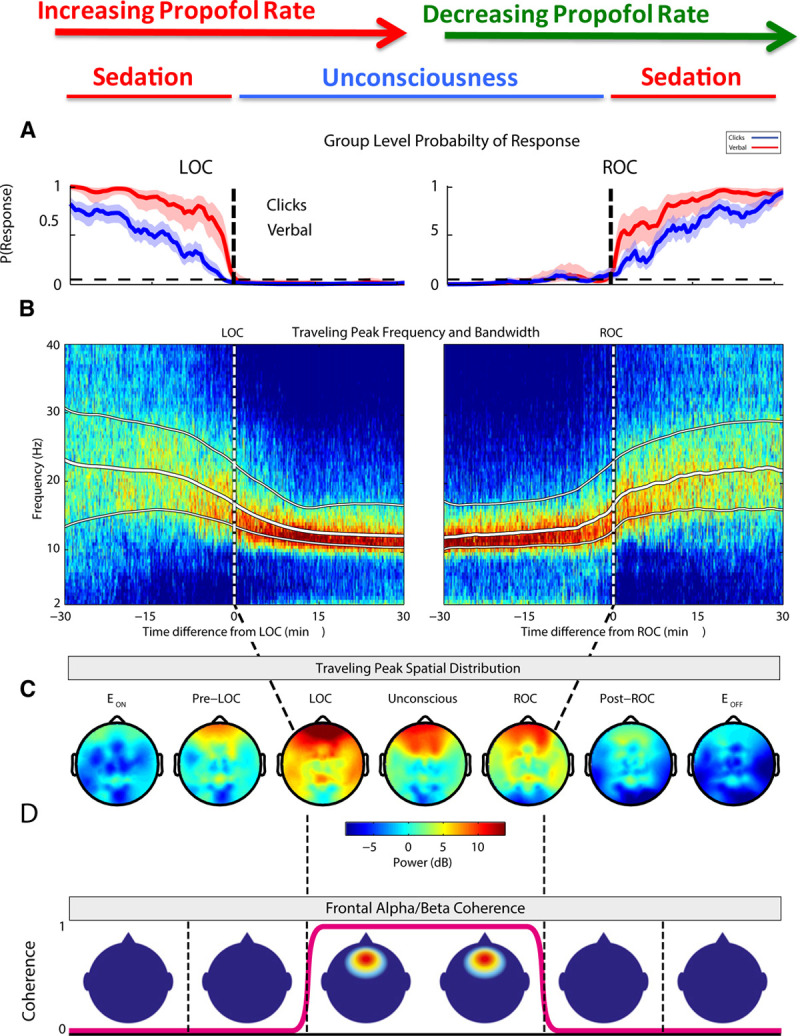
Figure 3.

The time course of behavioral and EEG changes in adults in response to a varied infusion rate of propofol. Group-level auditory stimulus response-probability curves (A), baseline-normalized spectrograms plotted with white lines representing the median, 25th, and 75th percentiles of the traveling peak bandwidth (B), and spatial differences in median frequency power (C) and coherence (D), all aligned with LOC and ROC behavioral timepoints. EEG indicates electroencephalogram; LOC, loss of consciousness; ROC, return of consciousness. The Figure was adapted with permission from Purdon et al.3
