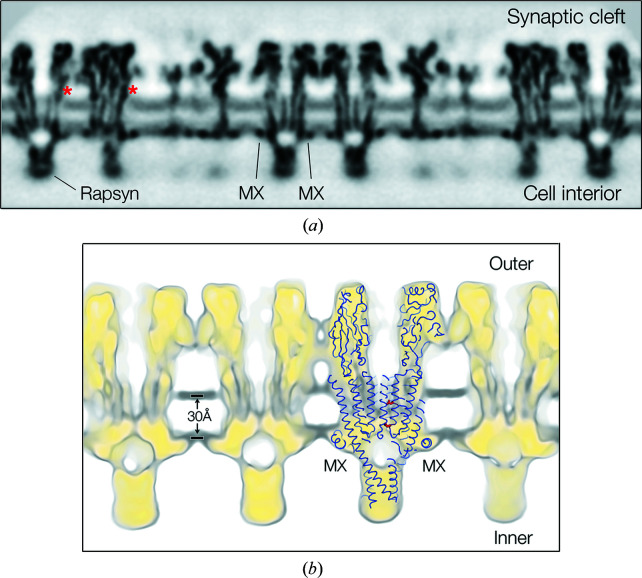
Figure 2.
Cross sections showing ACh receptors in the context of the lipid bilayer. (a) A profile view from (−16, 6) tubes, displaying the whole membrane as it would appear in situ. The unassigned density at the base of the receptor most probably arises from the attached (but not helically ordered) protein rapsyn (Toyoshima & Unwin, 1988 ▸; Zuber & Unwin, 2013 ▸). Asterisks identify patches of weakened lipid density next to the protein surfaces in the outer leaflet attributed to cholesterol. (b) A 15 Å slab through the membrane in a similar orientation and superimposed model (PDB entry 6uwz), relating the structure to the phospholipid headgroup locations (dark grey). Amino acid residues 9′Leu and −1′Glu of the β subunit are shown in red. The continuous yellow-to-grey background spans densities ranging from 3.5–0.8σ.

