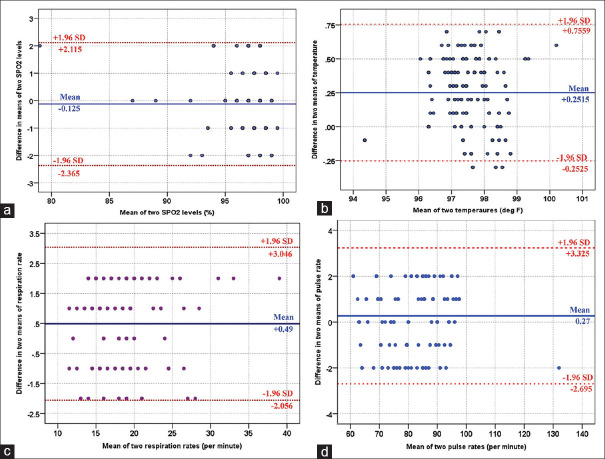
Figure 2.
Bland–Altman comparison between two devices for SpO2(a), temperature (b), respiratory rate (c), and pulse rate (d). X-axis is the mean value for each parameter. Y-axis is the difference in the means from both reference and device under study. Blue line is the mean bias and red dashed lines show 95% limits of agreement

