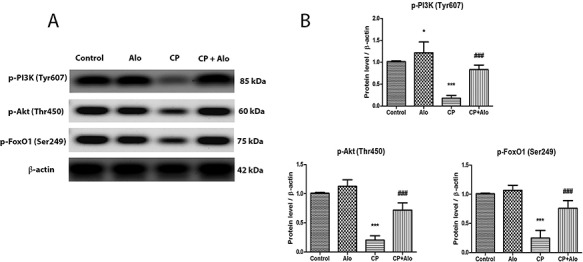
Figure 2.

(A) Representative western blot bands of hepatic p-phosphoinositide 3–kinase (p-PI3K) (Tyr607), p-protein kinase B (p-Akt) (Thr450) and p-forkhead box transcription factor of the O class 1 (p-FoxO1) (Ser249) protein levels. (B) Quantitation of hepatic p-PI3K, p-Akt, and p-FoxO1 protein levels in control, alogliptin (Alo) (20 mg/kg/day; p.o.), cyclophosphamide (CP) (200 mg/kg single dose; i.p.) and CP + Alo-treated groups. Data are presented as the mean ± SD (n = 8 per group; one-way ANOVA followed by Tukey’s multiple comparison test; ***P < 0.001, vs. the control group; ###P < 0.001, vs. the CP-treated group).
