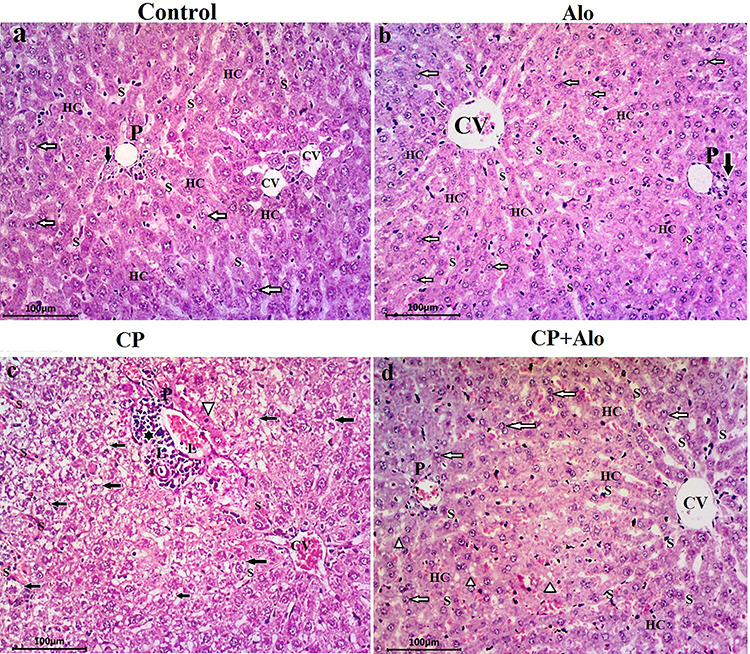
Figure 4.

Photomicrographs of liver tissue sections. (a, b): Control and alogliptin (Alo)-treated groups show normal hepatocellular architecture portrayed through normal hepatic cords (HC) arrangement around the central vein (CV), separated by blood sinusoids (S), polyhedral eosinophilic granular hepatocytes with central rounded vesicular one or two nuclei (white arrows). The portal triad (P) at the corner of hepatic lobule shows a branch of hepatic artery, portal vein and bile duct (black arrow). (c): Cyclophosphamide (CP)-treated group displays disturbed hepatic lobular architecture. Congestion of both central (CV) and portal veins is observed. Marked mononuclear leukocyte infiltration (L) at the portal tract area (black star) and within the congested blood sinusoids (S) is noticed. Widespread vacuolated-ballooned hepatocytes in the form of microvacuolization of cytoplasm with centrally placed pyknotic nuclei (black arrows) are detected. Hepatocytes at portal tract area displayed apoptotic changes in form of dark eosinophilic cytoplasm and small deeply stained pyknotic nuclei (white arrowhead). (d): CP + Alo-treated group shows a potentially alleviated hepatocellular architecture compared to control group and minimal changes in the form of few vacuolated hepatocytes (white arrowhead) (H & E stain, X200).
