
Figure 10.
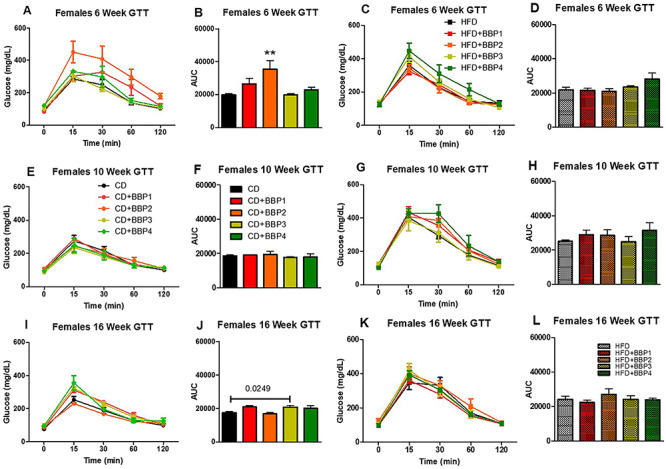
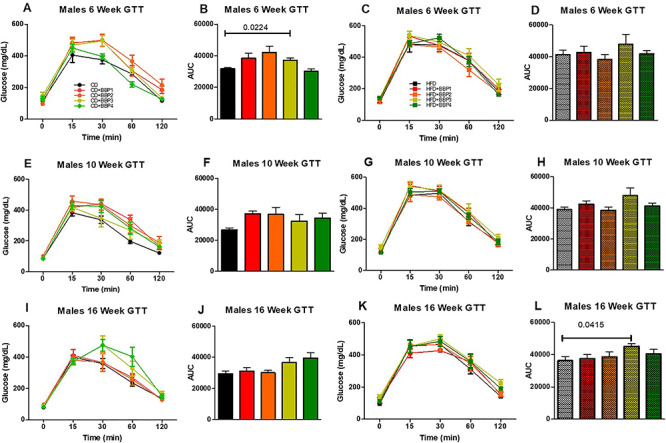
The effects of BBP on glucose intolerance in HFD fed mice. IP GTTs were performed at (A and C) 6 weeks, (E and G) 10 weeks, and (I and K) 16 weeks on CD, CD + BBP1, CD + BBP2, CD + BBP3, CD + BBP4 or HFD, HFD + BBP1, HFD + BBP2, HFD + BBP3, and HFD + BBP4 fed female (10i) and male (10ii) mice. Area under the curve (AUC) analysis of corresponding panels at (B and D) 6 weeks, (F and H) 10 weeks, and (J and L) 16 weeks on CD, CD + BBP1, CD + BBP2, CD + BBP3, CD + BBP4 or HFD, HFD + BBP1, HFD + BBP2, HFD + BBP3, and HFD + BBP4 female (10i) and male (10ii) mice. N = 4–6 mice/group, one-way ANOVA with Tukey’s post hoc test analysis or t-test was performed. For female, at 6 weeks, **P < 0.01, one-way ANOVA, CD + BBP2 female mice compared to CD female control. At 16 weeks, P = 0.0249, t-test, in CD + BBP3 female mice compared to CD female control. For male, at 6 weeks, P = 0.0224, t-test, CD + BBP3 male mice compared to CD male control. At 16 weeks, P = 0.0415, t-test, in HFD + BBP3 male mice compared to HFD male control.