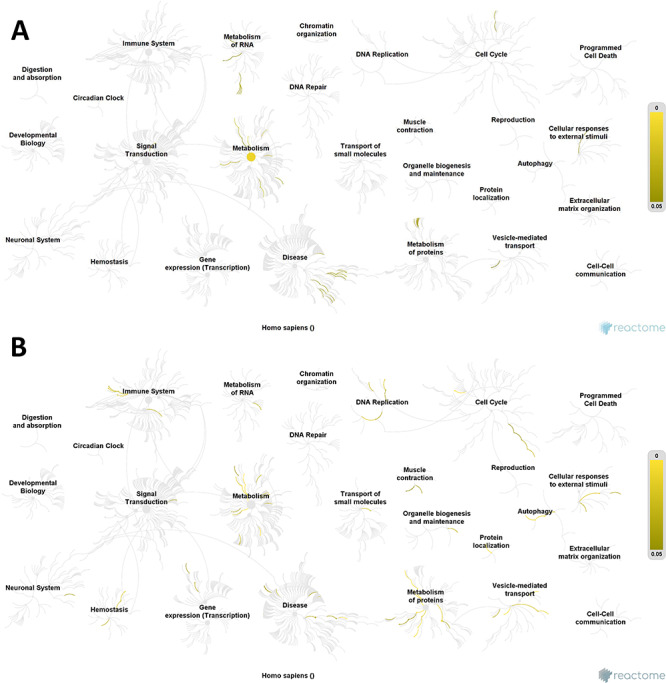
Figure 4.

Reactome pathway visualization. Pathways affected by (A) GLA supplementation; (B) ALA supplementation. Yellow lines indicate number of pathways affected in the different groups, according to the differentially expressed proteins found. Note that ALA has a greatest effect than GLA due to the greater number of affected pathways such as metabolism of proteins and DNA replication pathways.
