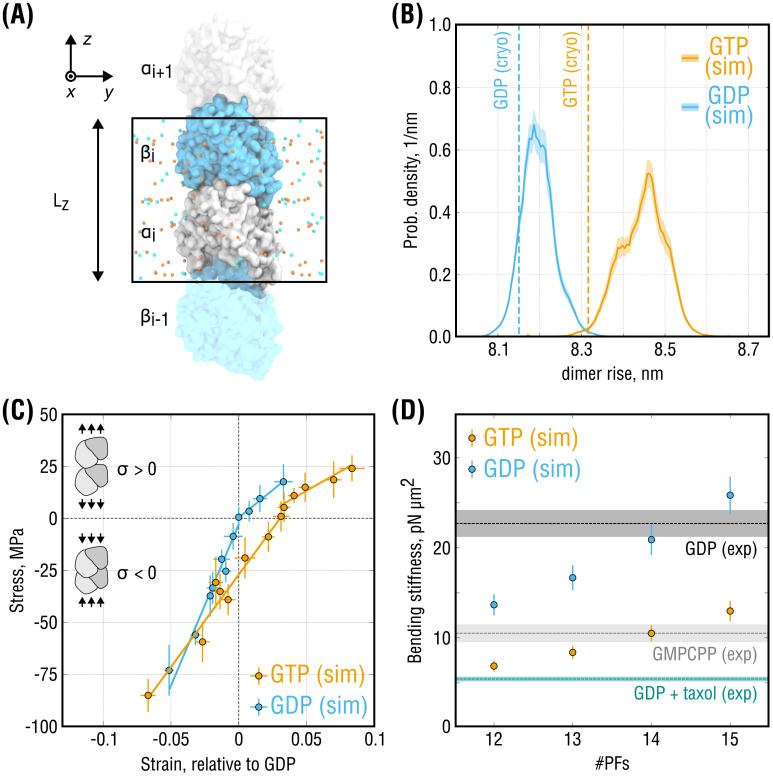
Fig 2. Elastic properties of isolated ‘infinite’ PFs.
(A), Simulation setup for the single-PF system. α-tubulin (gray) and β-tubulin (cyan) are shown in surface representation. Potassium and chloride ions are shown as orange and cyan spheres, respectively. Water molecules are hidden for clarity. Periodic box with the axial dimension Lz is marked by a black rectangle. (B), Equilibrium probability distributions of the dimer rise in the PFs obtained from stress-free simulations of the system in (A). Shaded areas show statistical uncertanties of the distributions estimated with umbrella sampling. Dashed lines indicate the dimer rise values observed in the cryo-EM densities of GMPCPP- and GDP-MTs. (C), Stress-strain curves calculated for the system in (A) in both GTP- (orange) and GDP-state (cyan). Strain is computed relative to the equilibrium dimer length of GDP-PF, and negative (positive) stresses correspond to PF compression (extension). Only separate fits to the positive and negative stress ranges are shown. (D), Bending stiffness parameters of GTP- and GDP-MTs calculated using the elastic moduli in (B) (all stress values) and for varying PF numbers (orange and cyan dots, respectively). Experimental values (dashed lines with shaded areas) represent inverse-variance weighted means and standard deviations that combine multiple independent thermal fluctuation measurements summarized in [29] and recently updated in [30].

