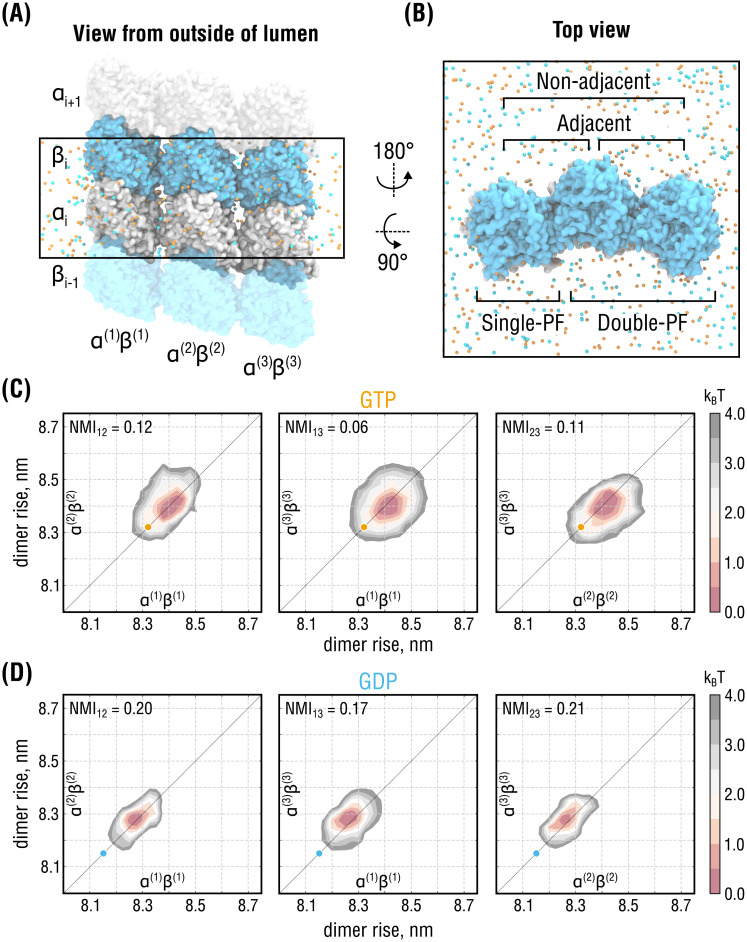
Fig 5. Lateral coupling induces long-range correlations between distant PFs.
(A) and (B), Side and top views of the simulation setup for the three-PF system mimicking a larger segment of the MT lattice. Color coding as in Figs 2A and 3A. Water molecules are hidden for clarity. Individual PFs are labeled as (1), (2) and (3). (C) and (D), Free energy energy landscapes of the system in (A) as a function of dimer rise and nucleotide state. The 3D landscapes were pairwise projected onto planes corresponding to 2D free energy landscapes of adjacent (α(1)β(1) − α(2)β(2) and α(2)β(2) − α(3)β(3), left and right, respectively) and non-adjacent PFs (α(1)β(1) − α(3)β(3), center). Orange and cyan circles indicate the dimer rise values observed in the cryo-EM densities of GMPCPP- and GDP-MTs, respectively. Note the shift between the GTP and GDP distributions by ∼0.2 nm along both reaction coordinates, consistent with the other simulations in Figs 2 and 3.

