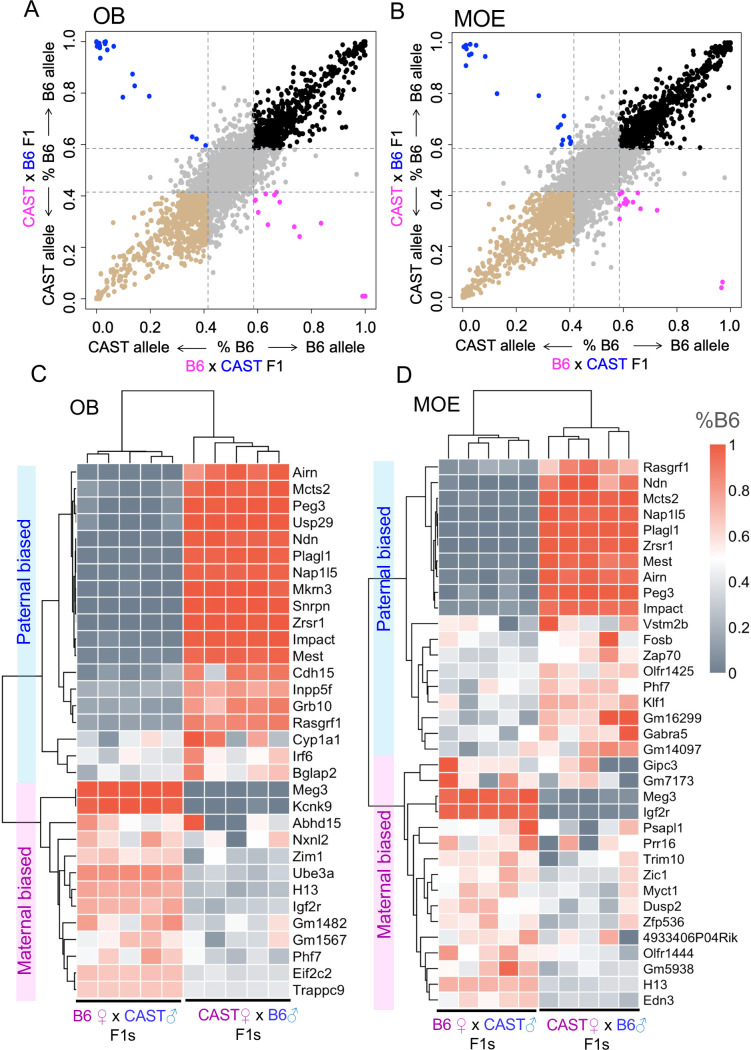
Fig 1. Analysis of allelic imbalance in the mouse olfactory system.
(A-B) Scatter plots of the average allelic bias ratios in olfactory bulb (OB) and main olfactory epithelium (MOE) in F1 individuals (females, aged 14 weeks) from reciprocal crosses between C57BL/6J (B6) and CAST/EiJ (CAST) strains. Pink: maternal biased expression; blue: paternal biased expression. Black: B6 strain biased expression; brown: CAST strain biased expression. The cut off ratio applied for biased expression is 0.6:0.4. (C-D) Heatmaps of parental allelic ratios for individual genes in each sample. The allelic ratios are quantified as the ratio of B6 allelic expression: %B6 = B6/(B6+CAST) and are clustered by samples (each column) and by allelic ratio of the genes expressed in OB and MOE (each row). Genes with average %B6 ratios >0.6 in B6 ♀x CAST ♂F1 mice and ratios <0.4 in CAST♀x B6 ♂F1 mice, are maternally-biased; whereas genes with average %B6 ratios <0.4 in B6♀x CAST♂F1 mice and %B6 ratios >0.6 for CAST♀xB6♂F1 mice are paternally-biased.

