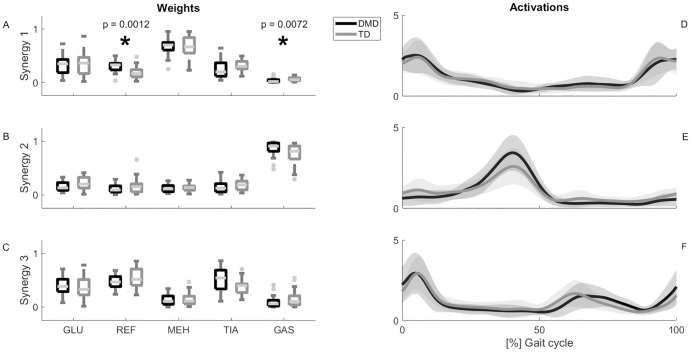
Fig 2. Results of SnPM {t} tests for the synergy activation curves and MWU tests for synergy weights (α = 0.01).
Panel A-C show the median + interquartile ranges of the weight of the GLU, REF, MEH, TIA and GAS to synergy one (A), two (B) and three (C) respectively. Significant differences between TD (grey) and DMD (black) based on the outcomes of MWU are indicated with an asterisk. Panel D–F show the mean values + standard deviations of the activations of synergy one (D), two (E) and three (F) respectively. Significant differences between TD (grey) and DMD (black) based on the outcomes of SnPM {t} are indicated as black bars. Abbreviations in alphabetic order: DMD = Duchenne muscular dystrophy; GAS = gastrocnemius; GLU = gluteus medius; MEH = medial hamstrings; MWU = Mann-Whitney U; REF = rectus femoris; SnPM {t}, statistical non-parametric mapping post-hoc two-tailed two-sampled t-test; TD = typically developing; TIA = tibialis anterior.

