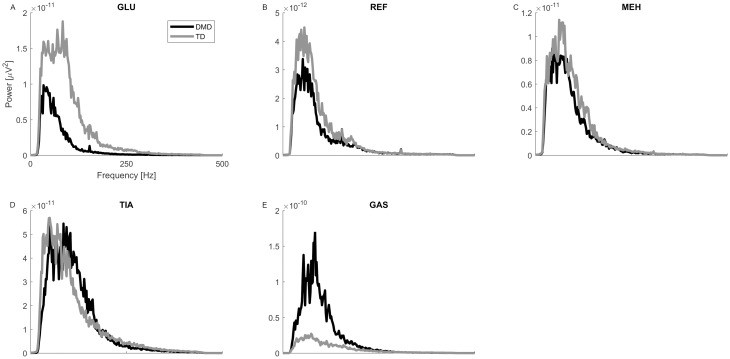
Fig 3. Power spectrum density plots of filtered sEMG signals (20–450 Hz).
(A-E) show the median curves of the GLU (A), REF (B), MEH (C), TIA (D) and GAS (E) for the children with DMD (black) and the TD children (grey). Abbreviations in alphabetic order: DMD = Duchenne muscular dystrophy; GAS = gastrocnemius; GLU = gluteus medius; Hz = Hertz; MEH = medial hamstrings; REF = rectus femoris; TD = typically developing; TIA = tibialis anterior; μV = microvolts.

