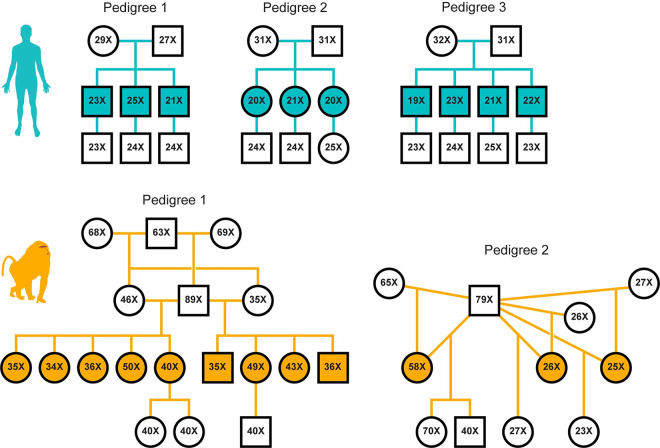
Fig 1. Pedigrees and mean depth of coverage of the sequenced individuals.
Relationships among individuals in 3 human families (top row, teal) and 2 extended baboon pedigrees (bottom row, orange) are shown. Squares and circles represent males and females, respectively, and are annotated for the mean depth of sequencing coverage of the individual. Filled shapes indicate the focal F1 individuals in which mutations were called. Sample identifiers and birth dates for all individuals are specified in S2 Table and S3 Table.

