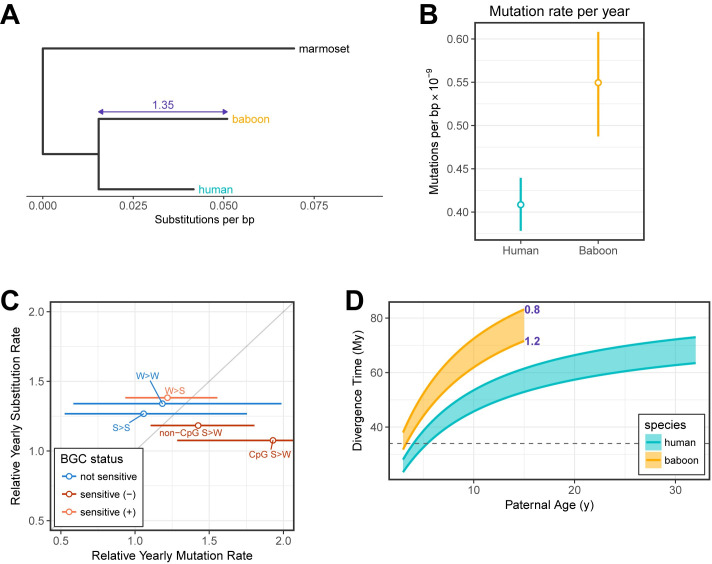
Fig 4. Implications of present-day human and baboon mutation rates for the evolution of the yearly mutation rate.
(A) Phylogenetic relationship between humans and baboons with a marmoset (New World monkey) outgroup. Branch lengths denote the autosomal substitution rate per bp since the OWM–marmoset split as measured using data from [29] for all mutation types at putatively neutral regions of the genome. The relative branch length difference between baboon and human lineages is indicated in purple. (B) Sex-averaged mutation rates per year. Mutation rates were based on fitted values for typical generation times (i.e., assuming 32.0 and 28.2 years in human males and females, respectively, and 10.7 and 10.2 years in baboon males and females) and turned into a sex-averaged per-year mutation rate following [42]. Vertical lines indicate the span covered by the 95% CIs of the intercept and slope of the age effect regressions. (C) The ratio of yearly mutation and substitution rates in baboon relative to human, as estimated for the different possible types involving combinations of strong (S: G/C) and weak (W: A/T) bp. Each point denotes a different type, and strong-to-weak (S>W) types were separated into those that occurred at a CpG or a non-CpG site. Points are colored according to whether GC-biased gene conversion is expected to favor (light red), disfavor (dark red), or have no effect (blue) on the mutation type. Horizontal lines denote 95% CIs on the mutation rate ratio computed by resampling of 50 cM blocks. The upper CI for CpG S>W extends out of frame to 2.8. Point estimates for the substitution rates in baboons and humans were taken from [29]. The identity line is drawn in gray for reference. (D) Predicted divergence times of humans and OWMs as a function of parental ages. Divergence times were predicted using mutation and autosomal substitution rates measured in humans (teal) and baboons (orange), across a span of plausible past generation times. Each point within the shaded areas represents the divergence time calculated at a particular paternal generation time (x-axis) and paternal-to-maternal generation time ratio (ranging from 0.8 to 1.2) as indicated in purple. The dashed gray line indicates a plausible upper bound for the split time inferred from the fossil record [49,50]. Underlying data for this figure can be found in S2 Data. BGC, biased gene conversion; bp, base pair; cM centimorgan; CpG, 5′-cytosine-phosphate-guanine-3′; OWM, Old World monkey.

