
Figure 2.
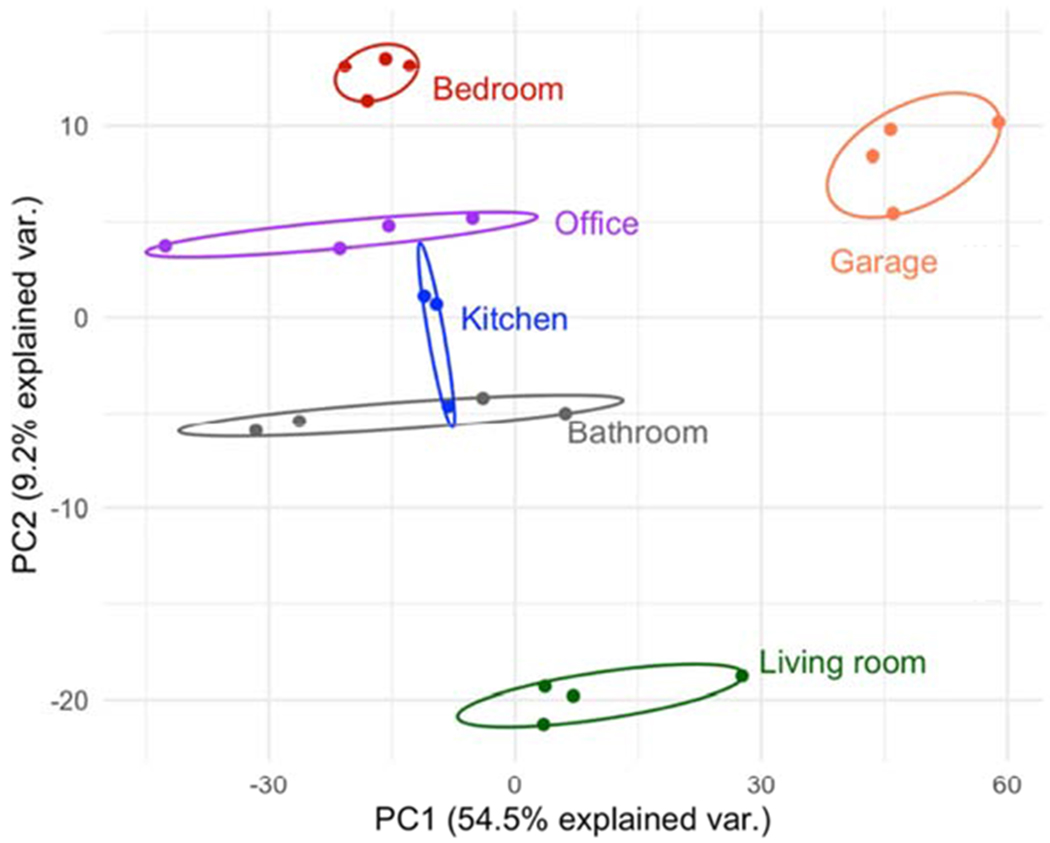
Biplot: Principal Component 1 (PC1; explained 54.5% of the total variance in the data) plotted against PC2 (explained 9.2% of the variance) showing clustering of samplers placed in the same location of house 2.
Official websites use .gov
A
.gov website belongs to an official
government organization in the United States.
Secure .gov websites use HTTPS
A lock (
) or https:// means you've safely
connected to the .gov website. Share sensitive
information only on official, secure websites.
Biplot: Principal Component 1 (PC1; explained 54.5% of the total variance in the data) plotted against PC2 (explained 9.2% of the variance) showing clustering of samplers placed in the same location of house 2.