Figure 6.
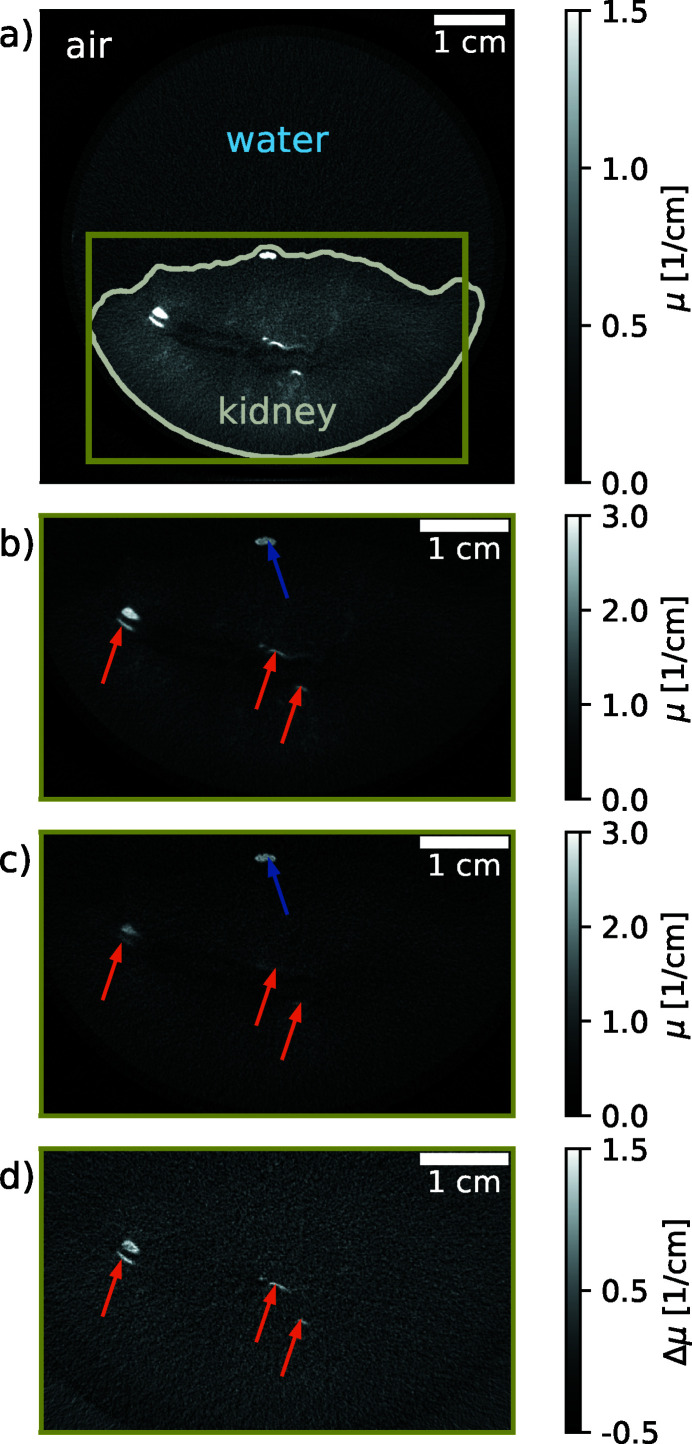
K-edge subtraction imaging. (a) Full slice of a porcine kidney containing one kidney stone where an iodine solution (Imeron; Bracco Imaging Deutschland GmbH, Germany; 400 mg ml−1) was injected into the arteries. The kidney was placed into a plastic beaker glass filled with water. The dynamic range of the image has been adapted for water and soft tissue and the contour of the kidney is plotted in grey for better visibility. (b) The same slice cropped to the region indicated in green in (a) which contains the kidney. Here and in the following sub-figures the full dynamic range is displayed. (c) Image of the same sample recorded with an iodine filter. (d) The same slice of the resulting K-edge subtraction volume containing only the iodine, i.e. the material with the K-edge. Orange arrows point to vessels containing iodine contrast agent, while the blue arrow indicates the kidney stone.

