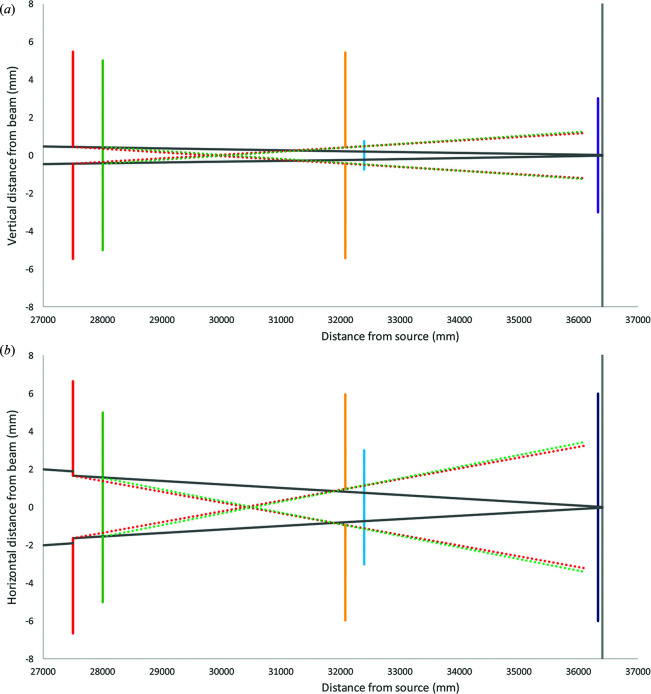
Figure 3.
The slit geometry and scatter close to the sample, (a) in the vertical direction and (b) in the horizontal direction, showing the antiscatter slits (red), silicon nitride window (green), guard slits (yellow), sample (blue), beamstop (purple) and detector face (grey). The projections of scatter from the guard slit and silicon nitride window through the antiscatter slits are shown as red and green dotted lines, respectively.

