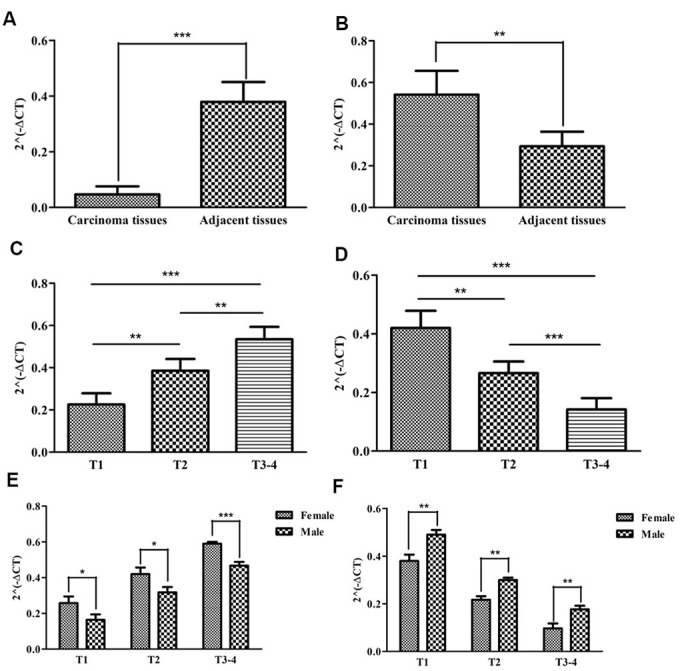
Figure 10.

The expression levels of two sIRlncRs and their correlations with gender and T-stages. The results of RT-qPCR of the two sIRlncRs’ expression levels in pRCC tissues and adjacent tissues. The expression levels of SNHG16 in carcinoma tissues and adjacent tissues (A). The expression levels of ADAMTS9-AS1 in carcinoma tissues and adjacent tissues (B). The expression levels of SNHG16 in pRCC tissues with different T-stages (C). The expression levels of ADAMTS9-AS1 in pRCC tissues with different T-stages (D). The expression levels of SNHG16 in female and male patients (E). The expression levels of ADAMTS9-AS1 in female and male patients (F). The data are expressed as the means ± SD. ***P<0.001, **P<0.01, *P<0.05.
